Documentation
user guide
Diagram Animation Editor - User Guide
A comprehensive guide to creating animated architecture diagrams and system visualizations.
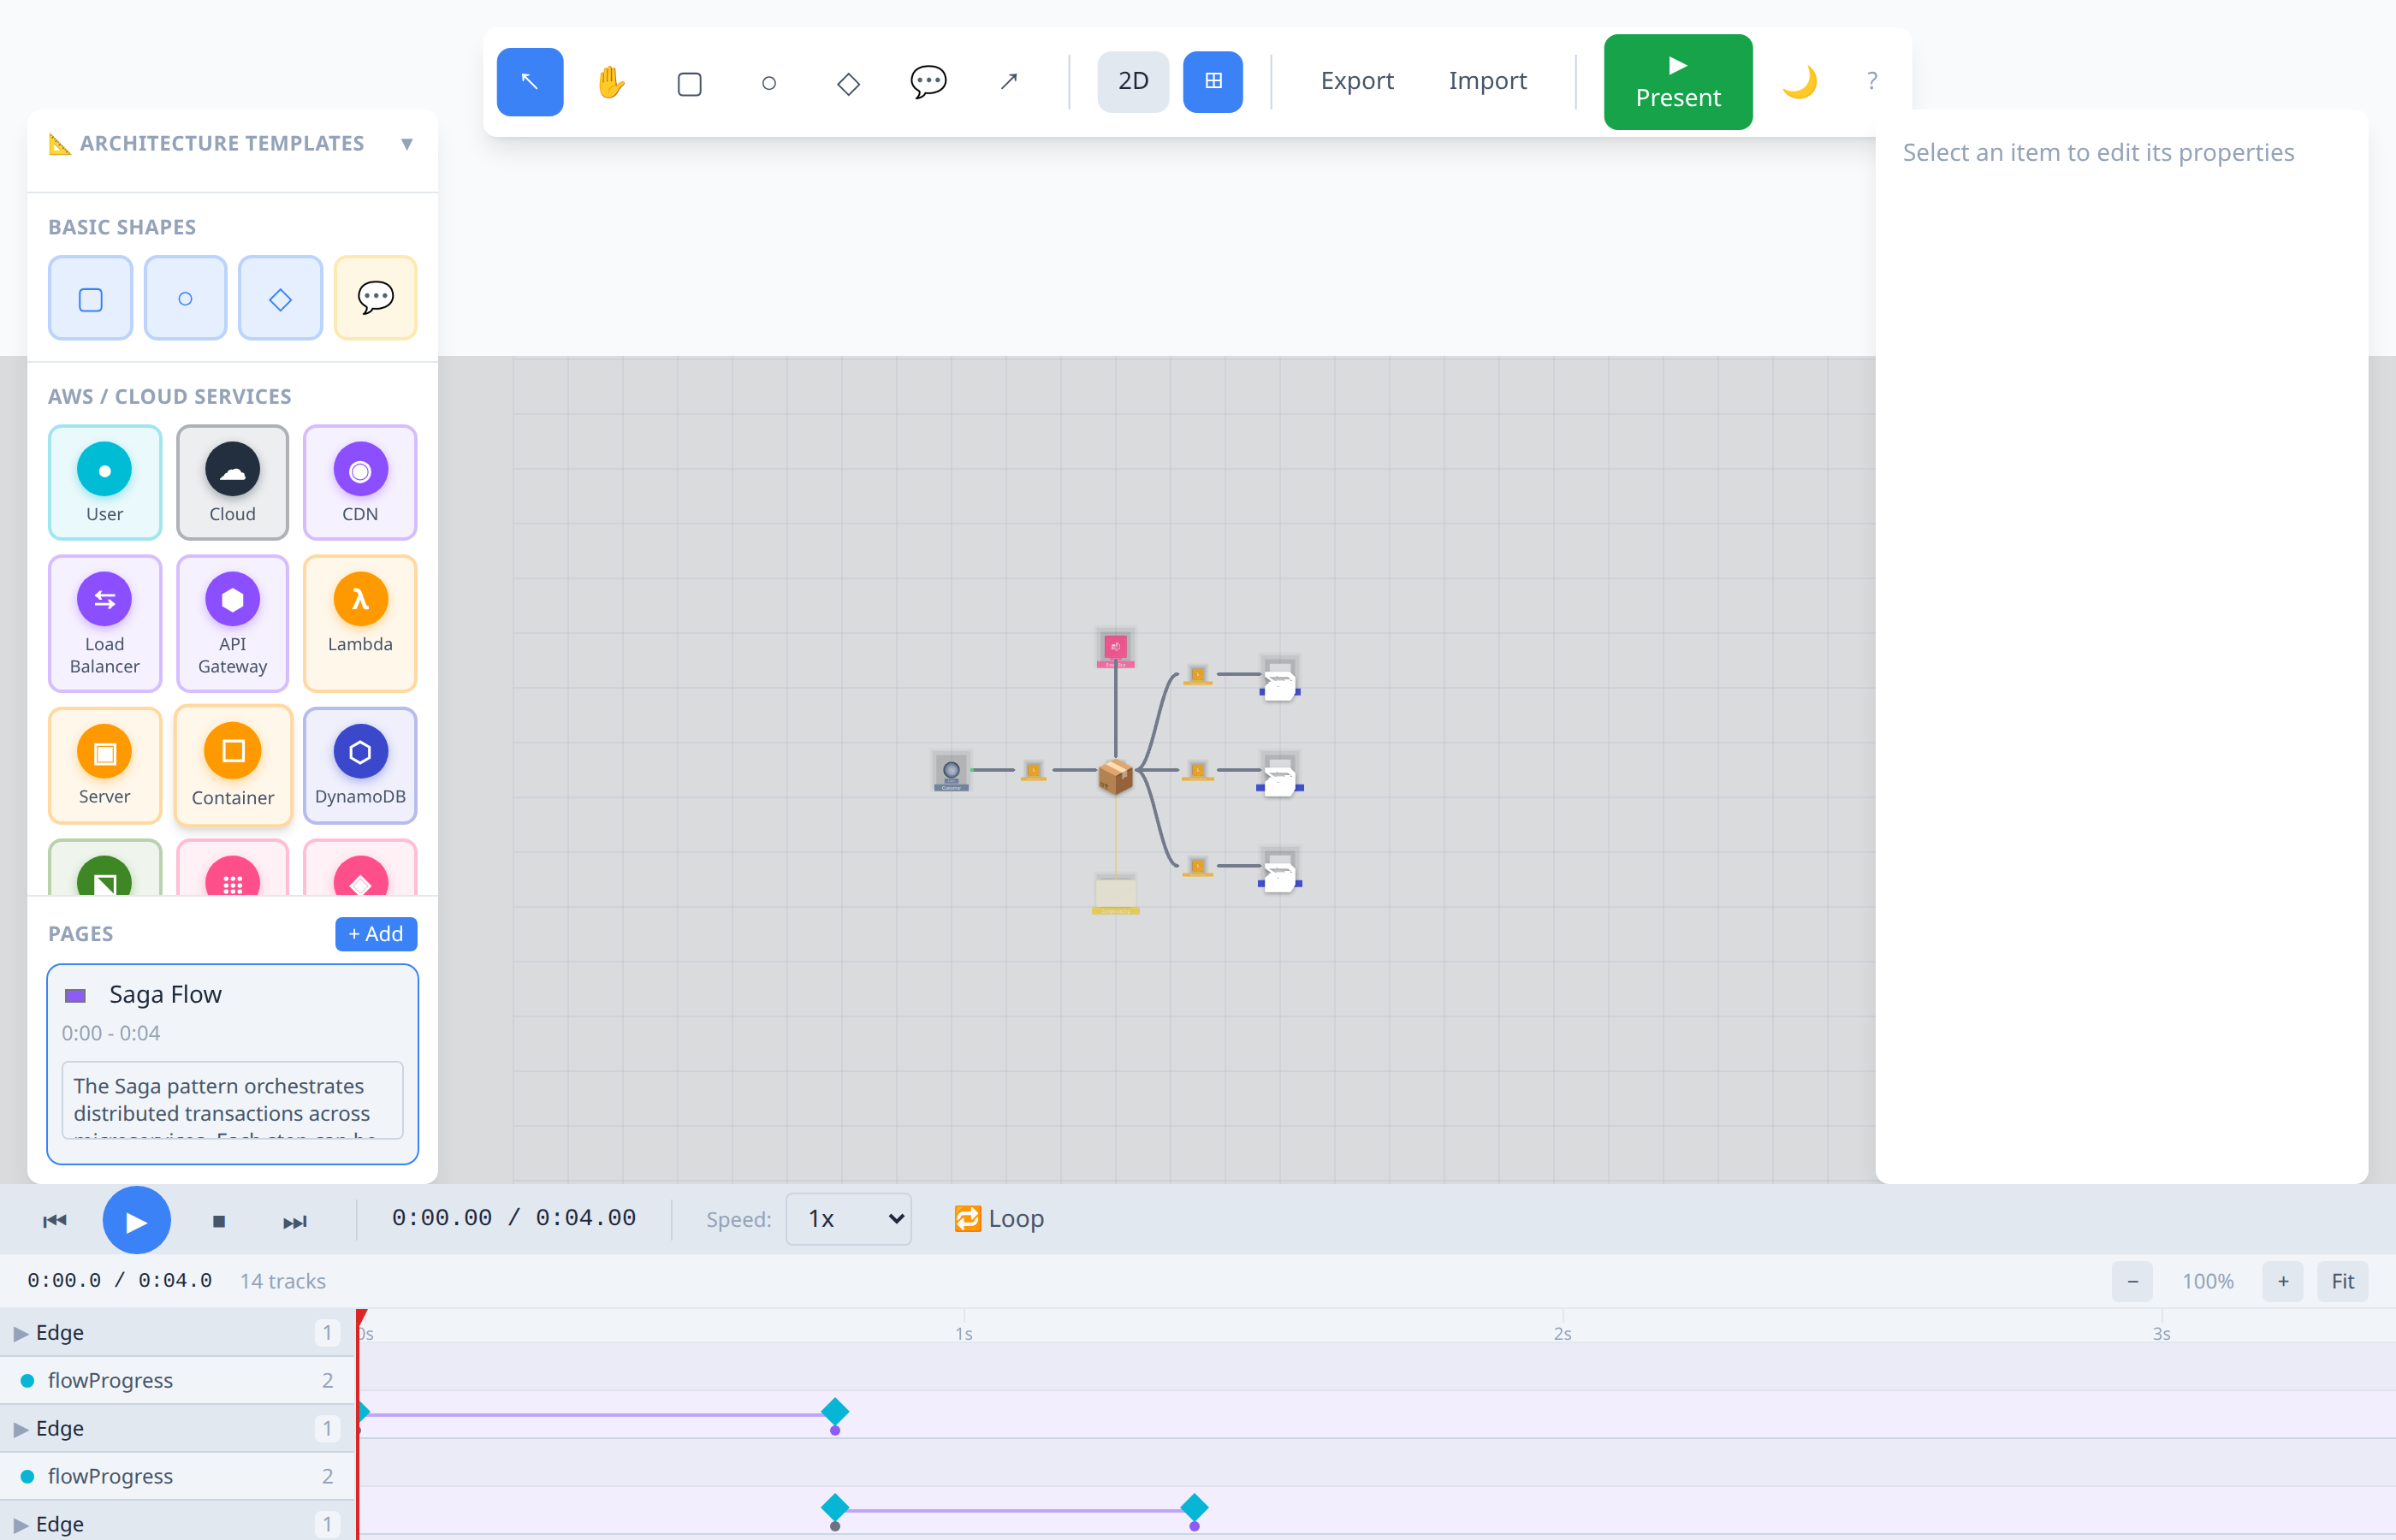
Table of Contents
- Getting Started
- Interface Overview
- Creating Diagrams
- Using Templates
- Animation System
- Timeline Editor
- Presentation Mode
- Import & Export
- Keyboard Shortcuts
- Tips & Tricks
Getting Started
Prerequisites
- Node.js 18+
- npm or yarn
Installation
git clone https://github.com/jonathanleahy/diagram-animation.git
cd diagram-animation/frontend
npm install
npm run dev
The application opens at http://localhost:3001.
First Launch
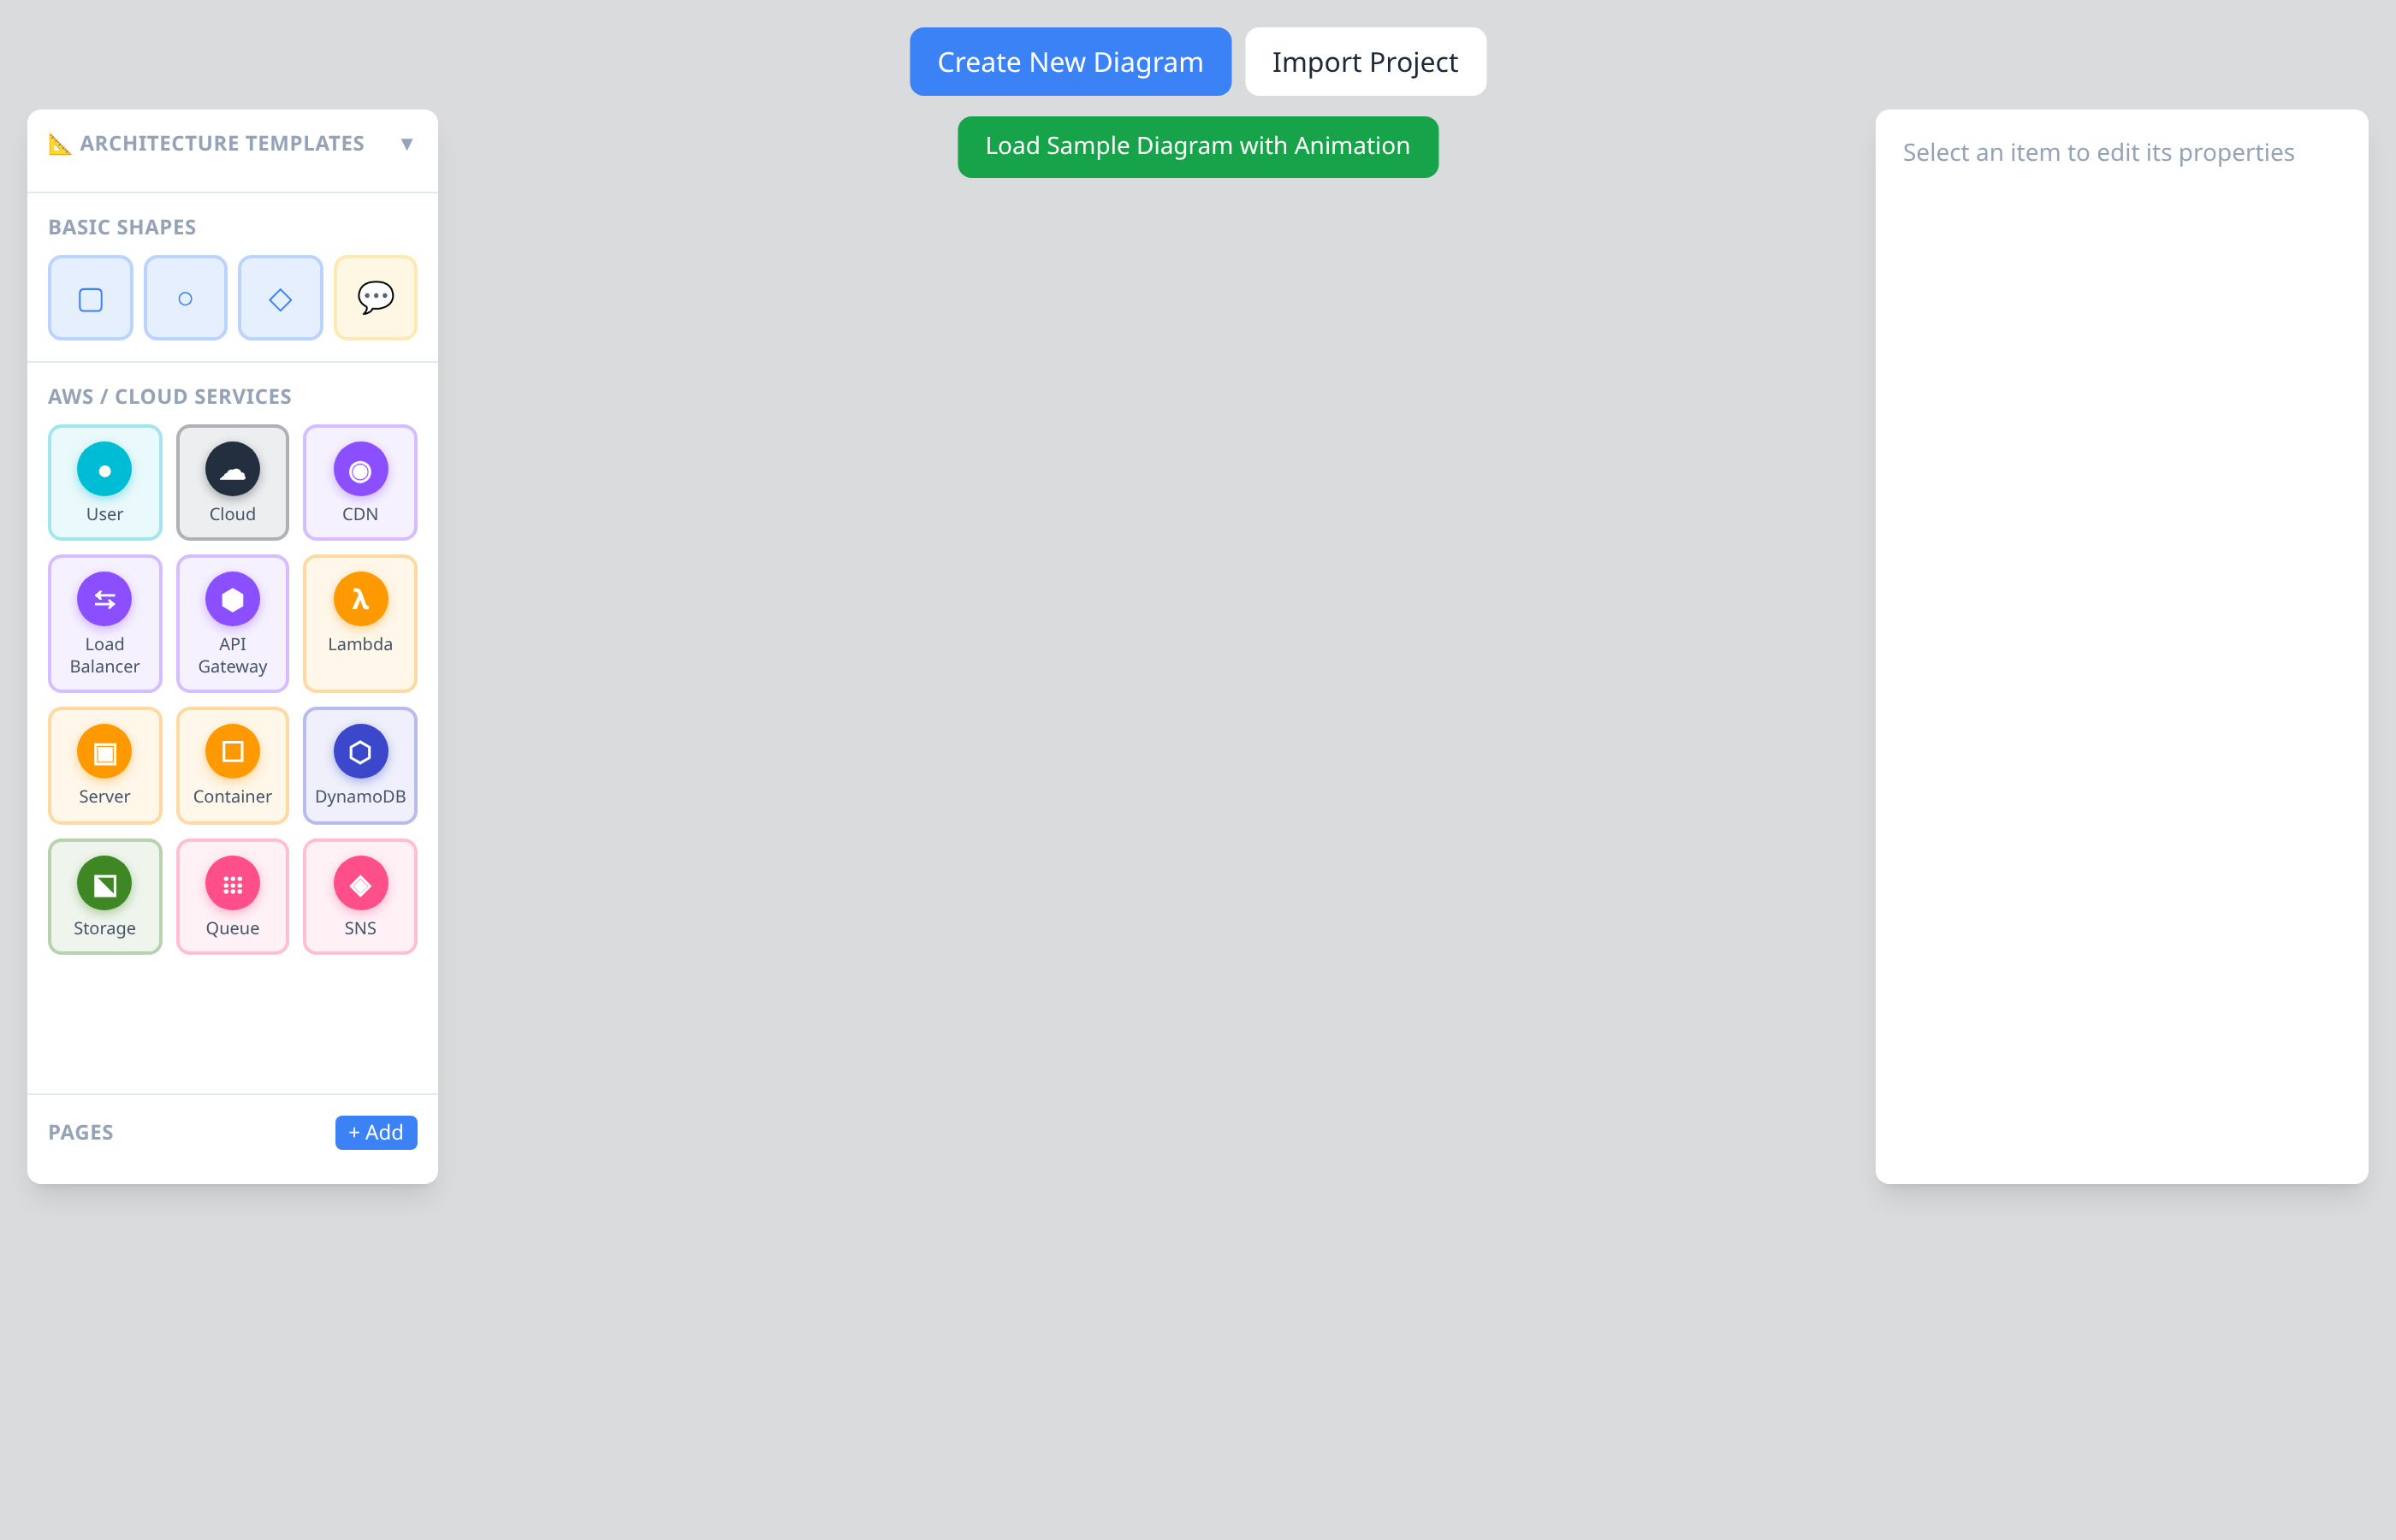
When you first open the app, you'll see the landing screen with options to:
- Create New Diagram - Start with a blank canvas
- Import Project - Load a previously exported JSON file
- Load Sample Diagram - Try a pre-built example with animations
Interface Overview
The editor has four main areas:
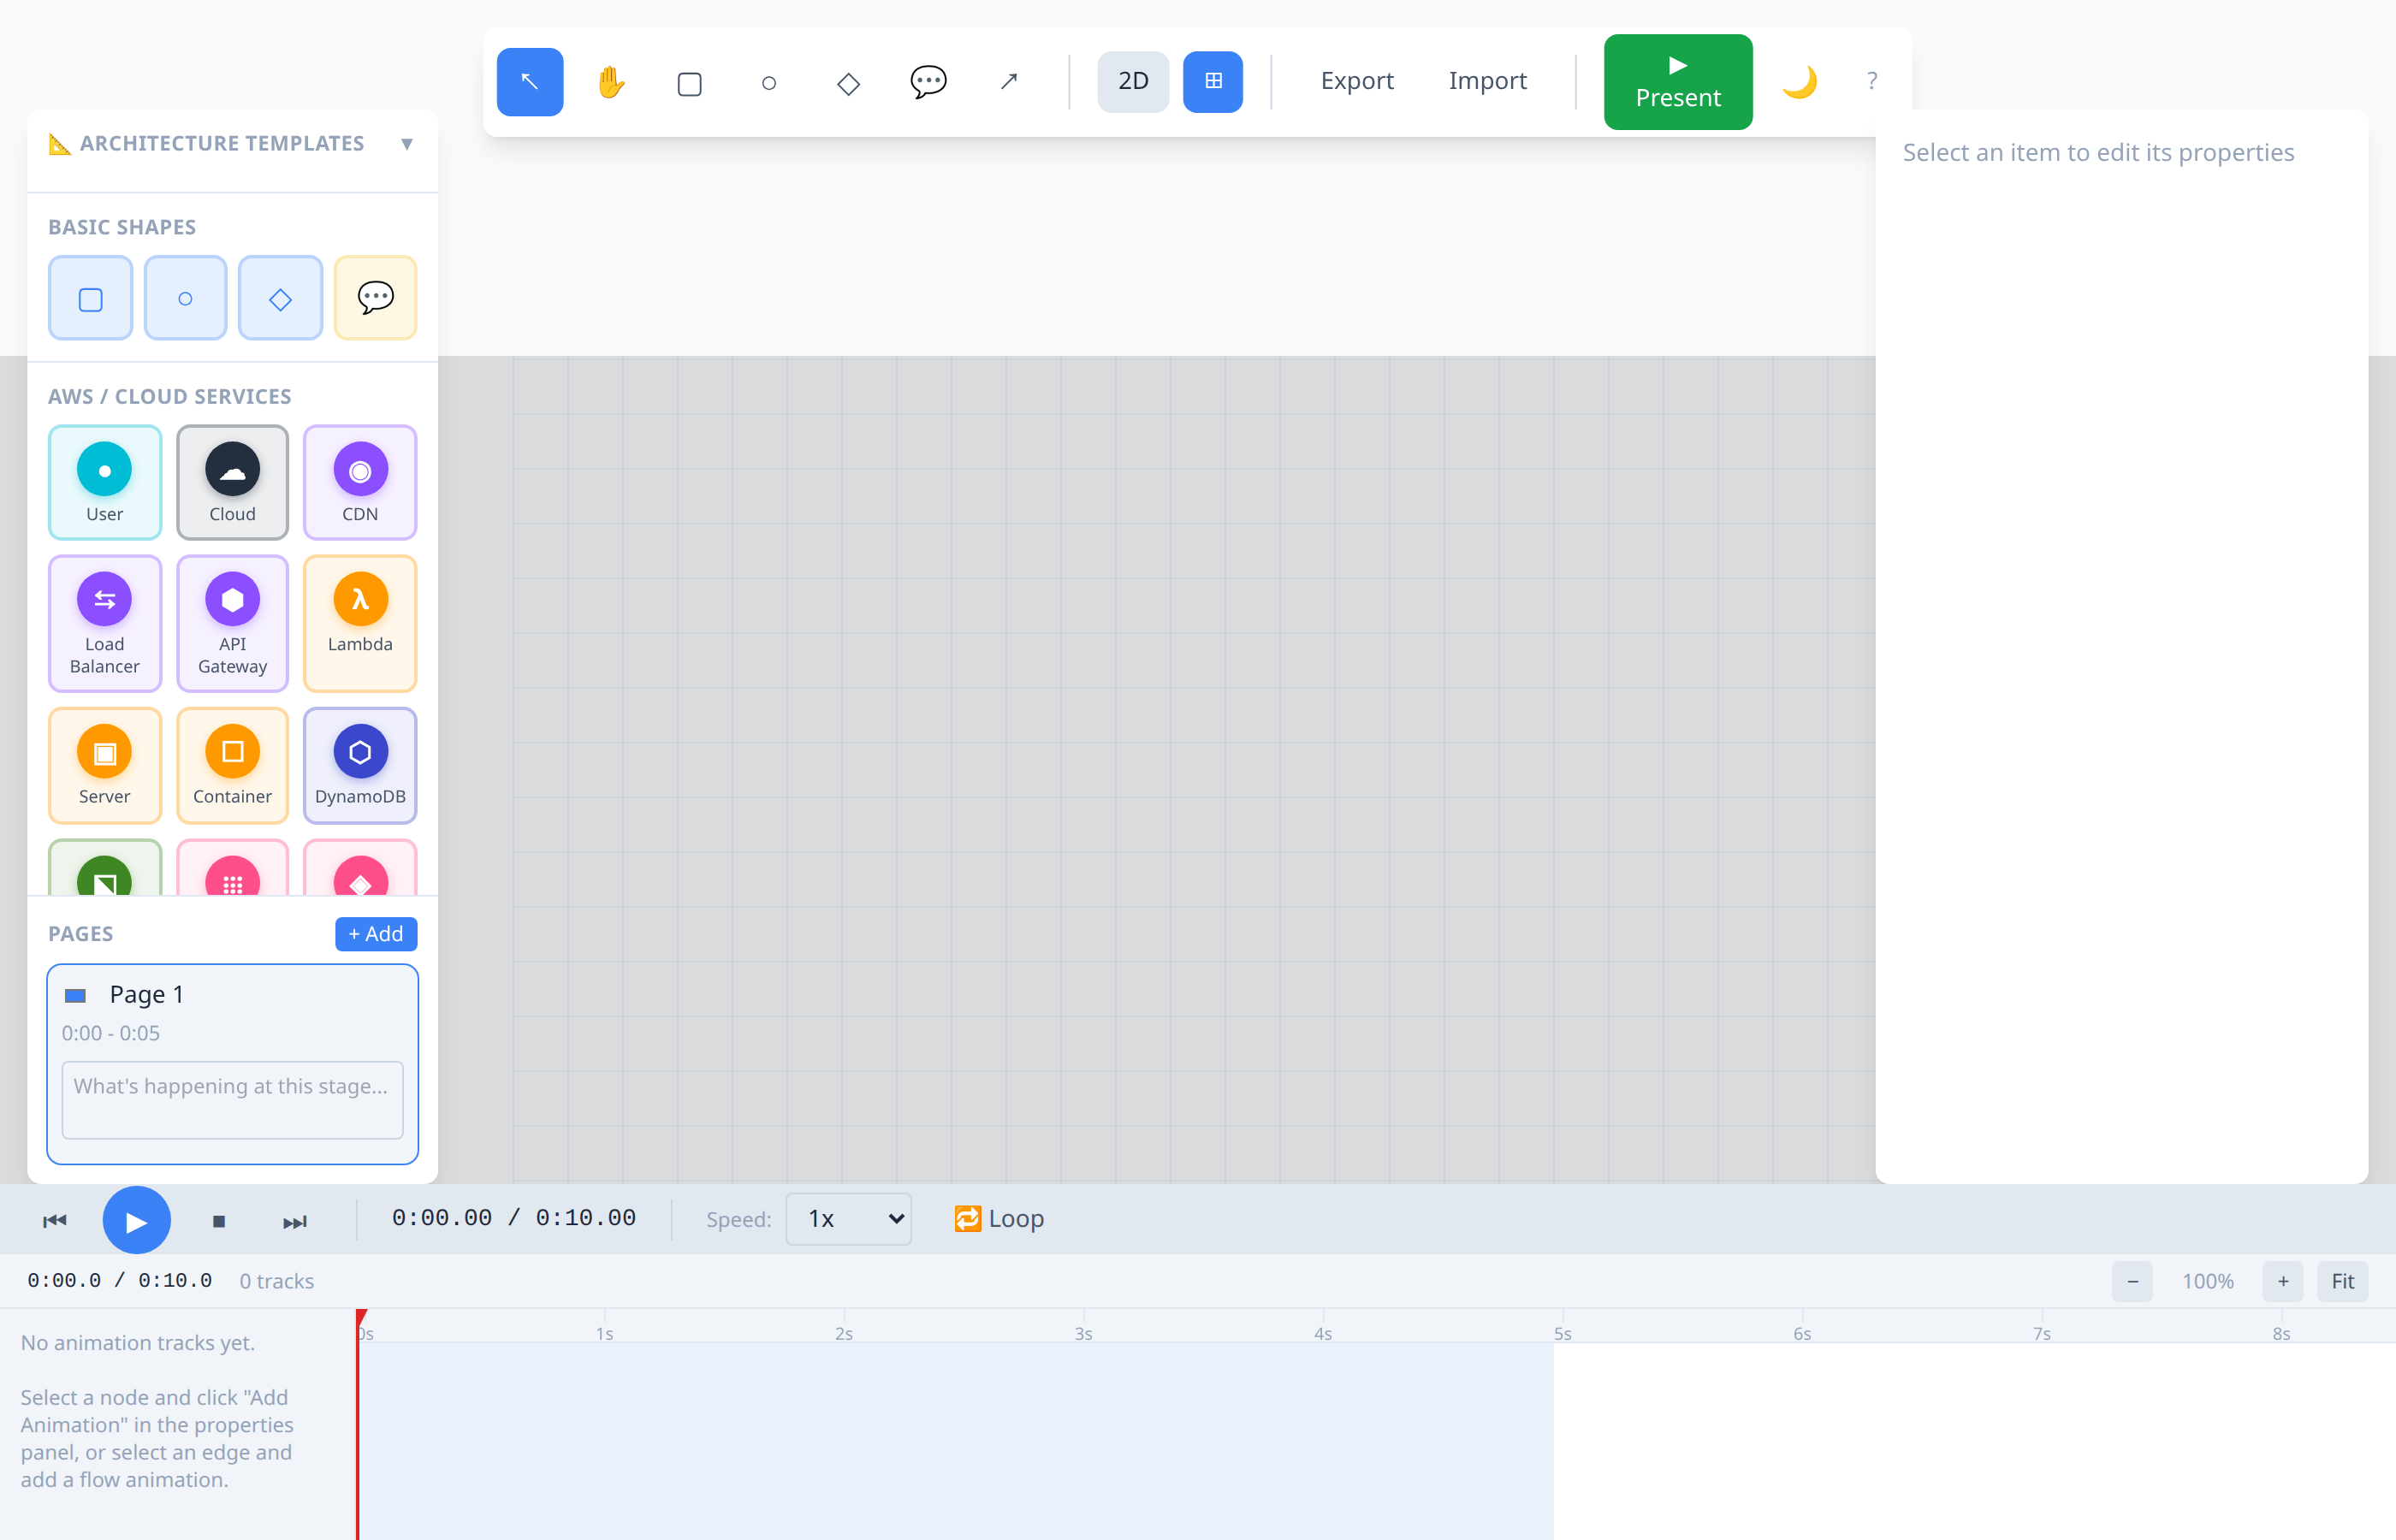
1. Toolbar (Top)
The toolbar provides quick access to:
| Button | Function |
|---|---|
| Select (V) | Select and move nodes |
| Pan (H) | Pan the camera |
| Rectangle (R) | Draw a rectangle |
| Circle (C) | Draw a circle |
| Diamond (D) | Draw a diamond |
| Callout (T) | Add a text callout |
| Edge (E) | Draw a connection between nodes |
| 2D/3D | Toggle between top-down and isometric view |
| Grid | Toggle the background grid |
| Export | Save project to JSON |
| Import | Load project from JSON |
| Present | Enter presentation mode |
| Theme | Toggle light/dark mode |
2. Sidebar (Left)
The sidebar contains:
- Architecture Templates - Pre-built diagram templates
- Basic Shapes - Rectangle, Circle, Diamond, Callout
- AWS / Cloud Services - Cloud architecture shapes (User, Cloud, CDN, Load Balancer, API Gateway, Lambda, Server, Container, DynamoDB, Storage, Queue, SNS)
- Pages - Manage presentation pages with descriptions
3. Properties Panel (Right)
Select any node or edge to edit its properties:
- Label text
- Fill and stroke colors
- Size and position
- Opacity
- Animation presets
4. Timeline (Bottom)
The timeline panel shows all animation tracks and keyframes:
- Transport controls (play, pause, stop, loop)
- Playback speed control
- Zoom-adjustable timeline view
- Color-coded tracks by property type
- Keyframe editing with drag support
Creating Diagrams
Adding Shapes
From the sidebar: Click any shape in the Basic Shapes or AWS / Cloud Services section to add it to the canvas.
From the toolbar: Select a drawing tool (Rectangle, Circle, Diamond, Callout) then click on the canvas to place it.
Connecting Nodes
Editing Nodes
- Move: Click and drag any node with the Select tool
- Resize: Drag the edge handles of a selected node
- Edit label: Select the node and modify the label in the Properties panel
- Style: Change colors, opacity, and stroke in the Properties panel
- Delete: Select and press
DeleteorBackspace
Right-Click Context Menu
Right-click on the canvas to access:
- Copy, Cut, Paste
- Duplicate selection
- Delete selected items
Using Templates
Templates are pre-built architecture diagrams with animations already configured.
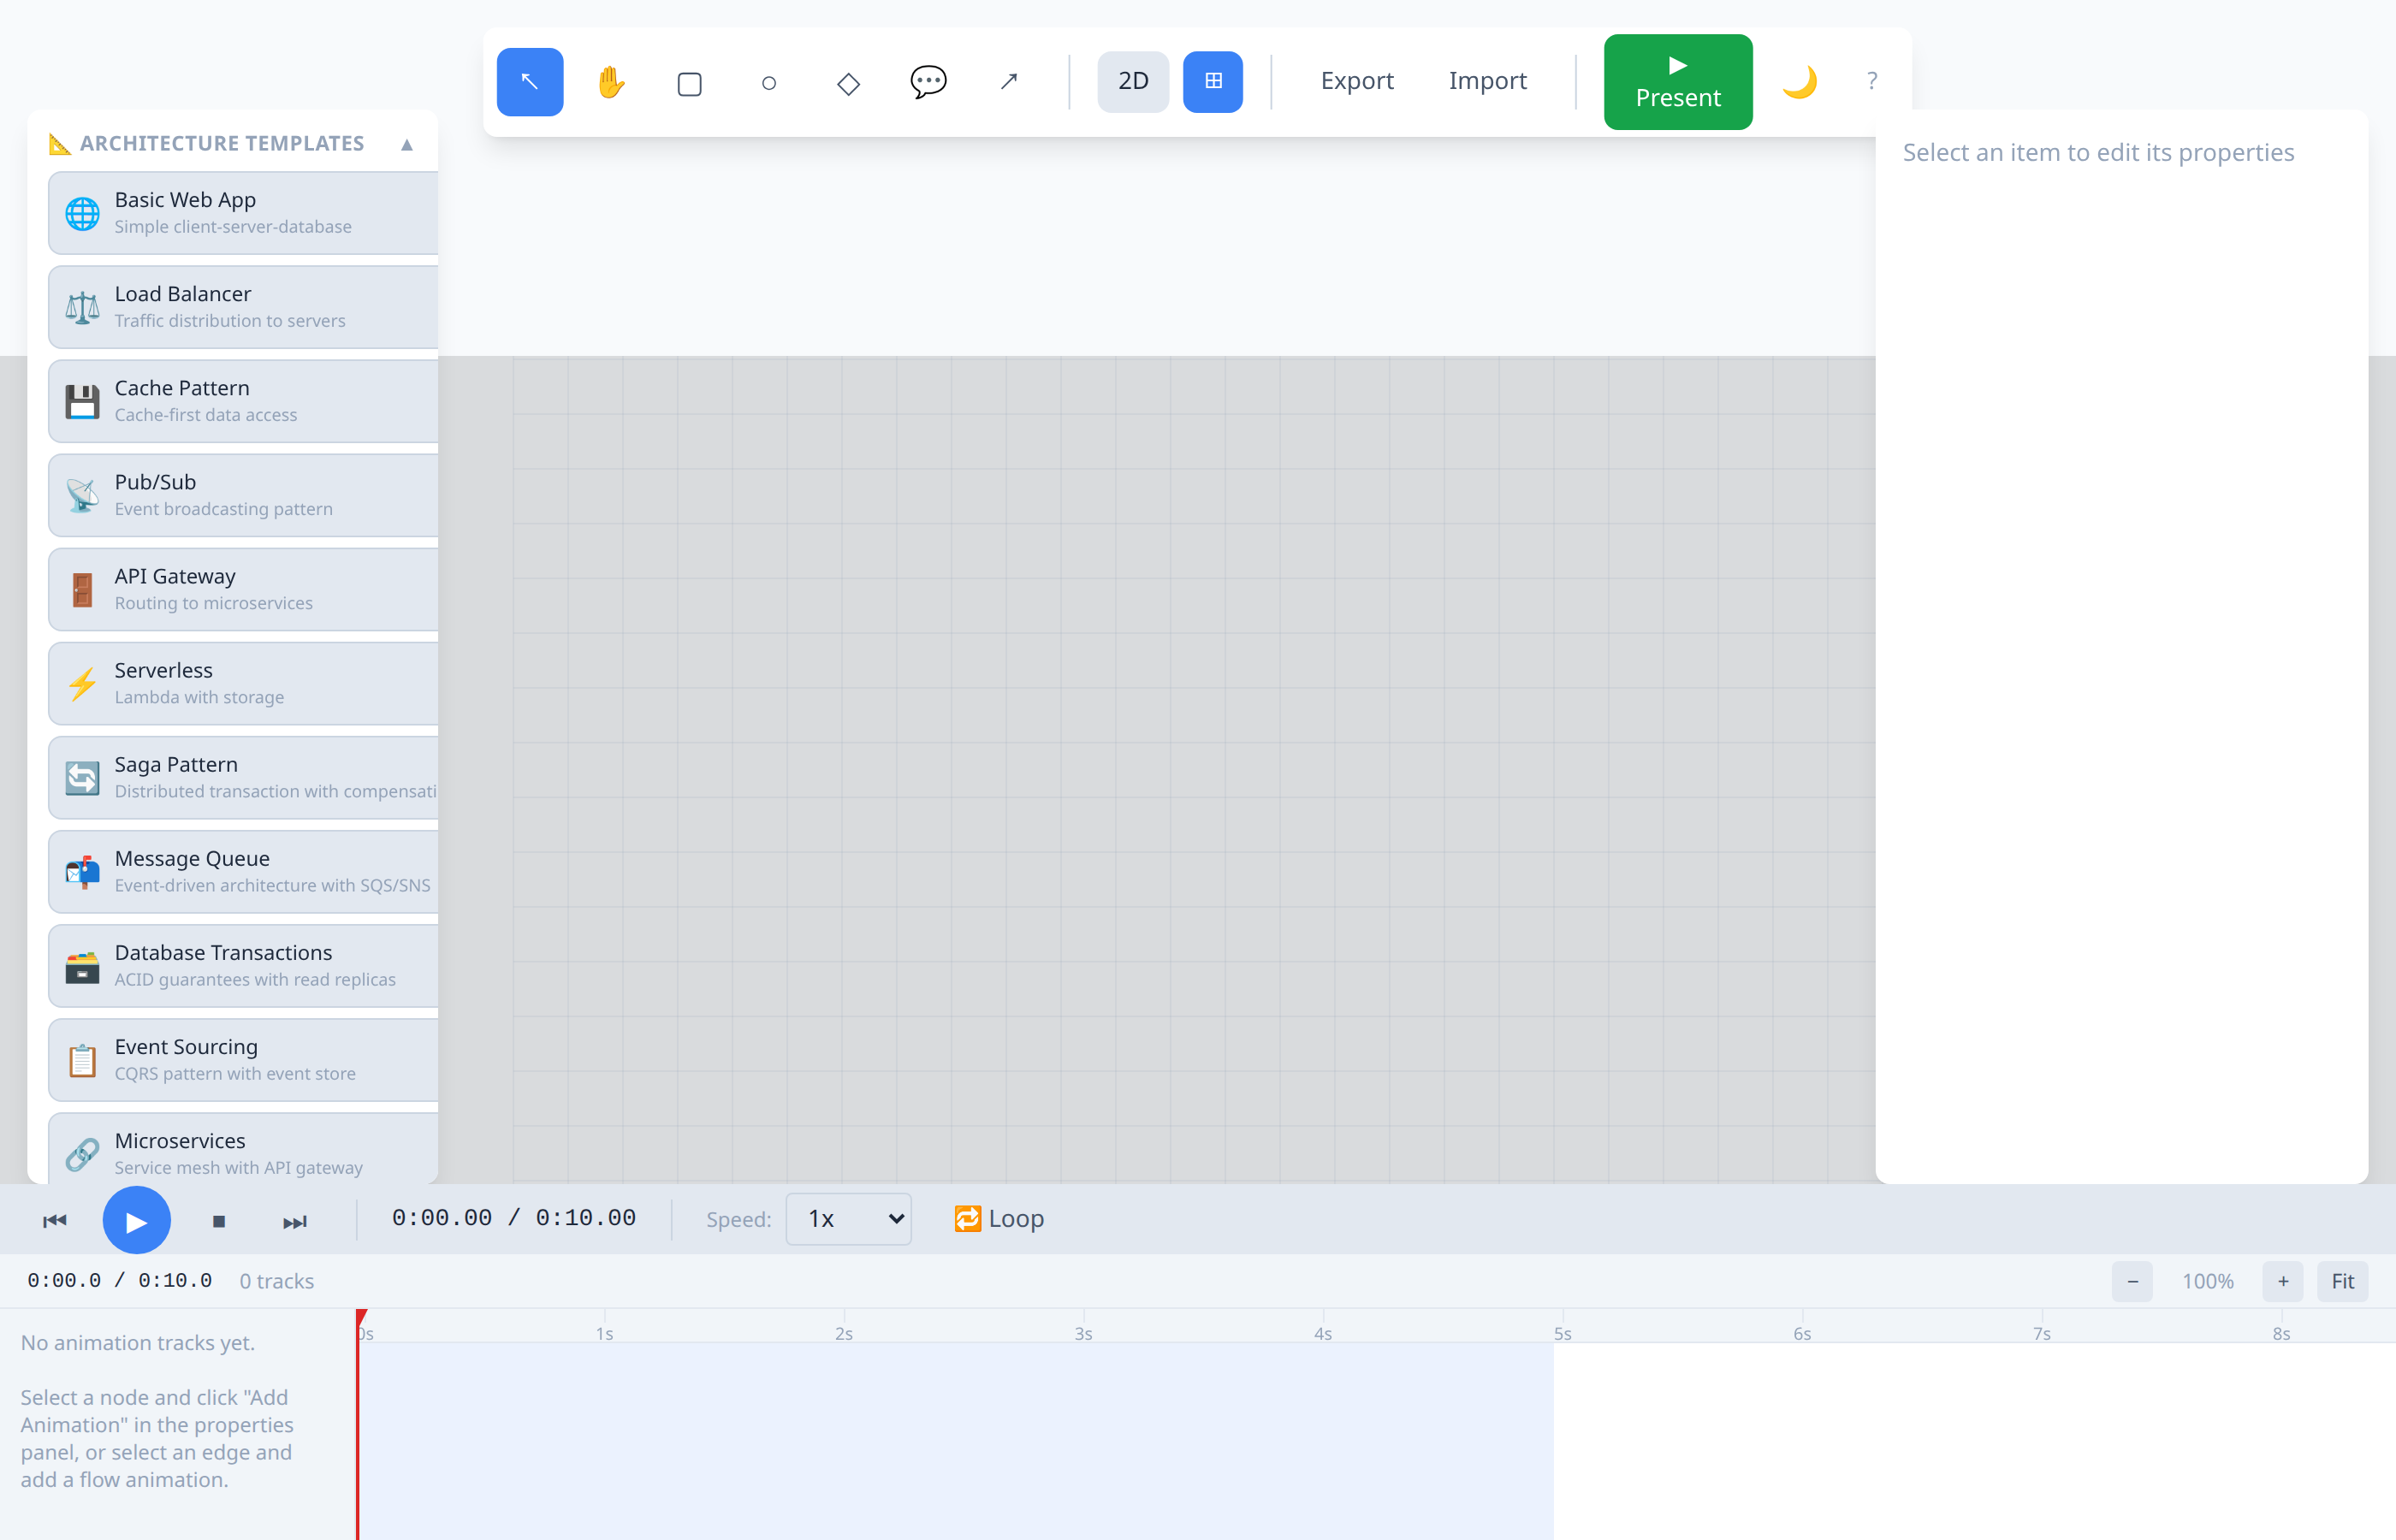
Loading a Template
Available Templates
#### Simple Templates
| Template | Description |
|---|---|
| Basic Web App | Browser to server to database flow |
| Load Balancer | Traffic distribution to multiple servers |
| Cache Pattern | Cache-aside pattern with database fallback |
| Pub/Sub | Publisher-subscriber messaging pattern |
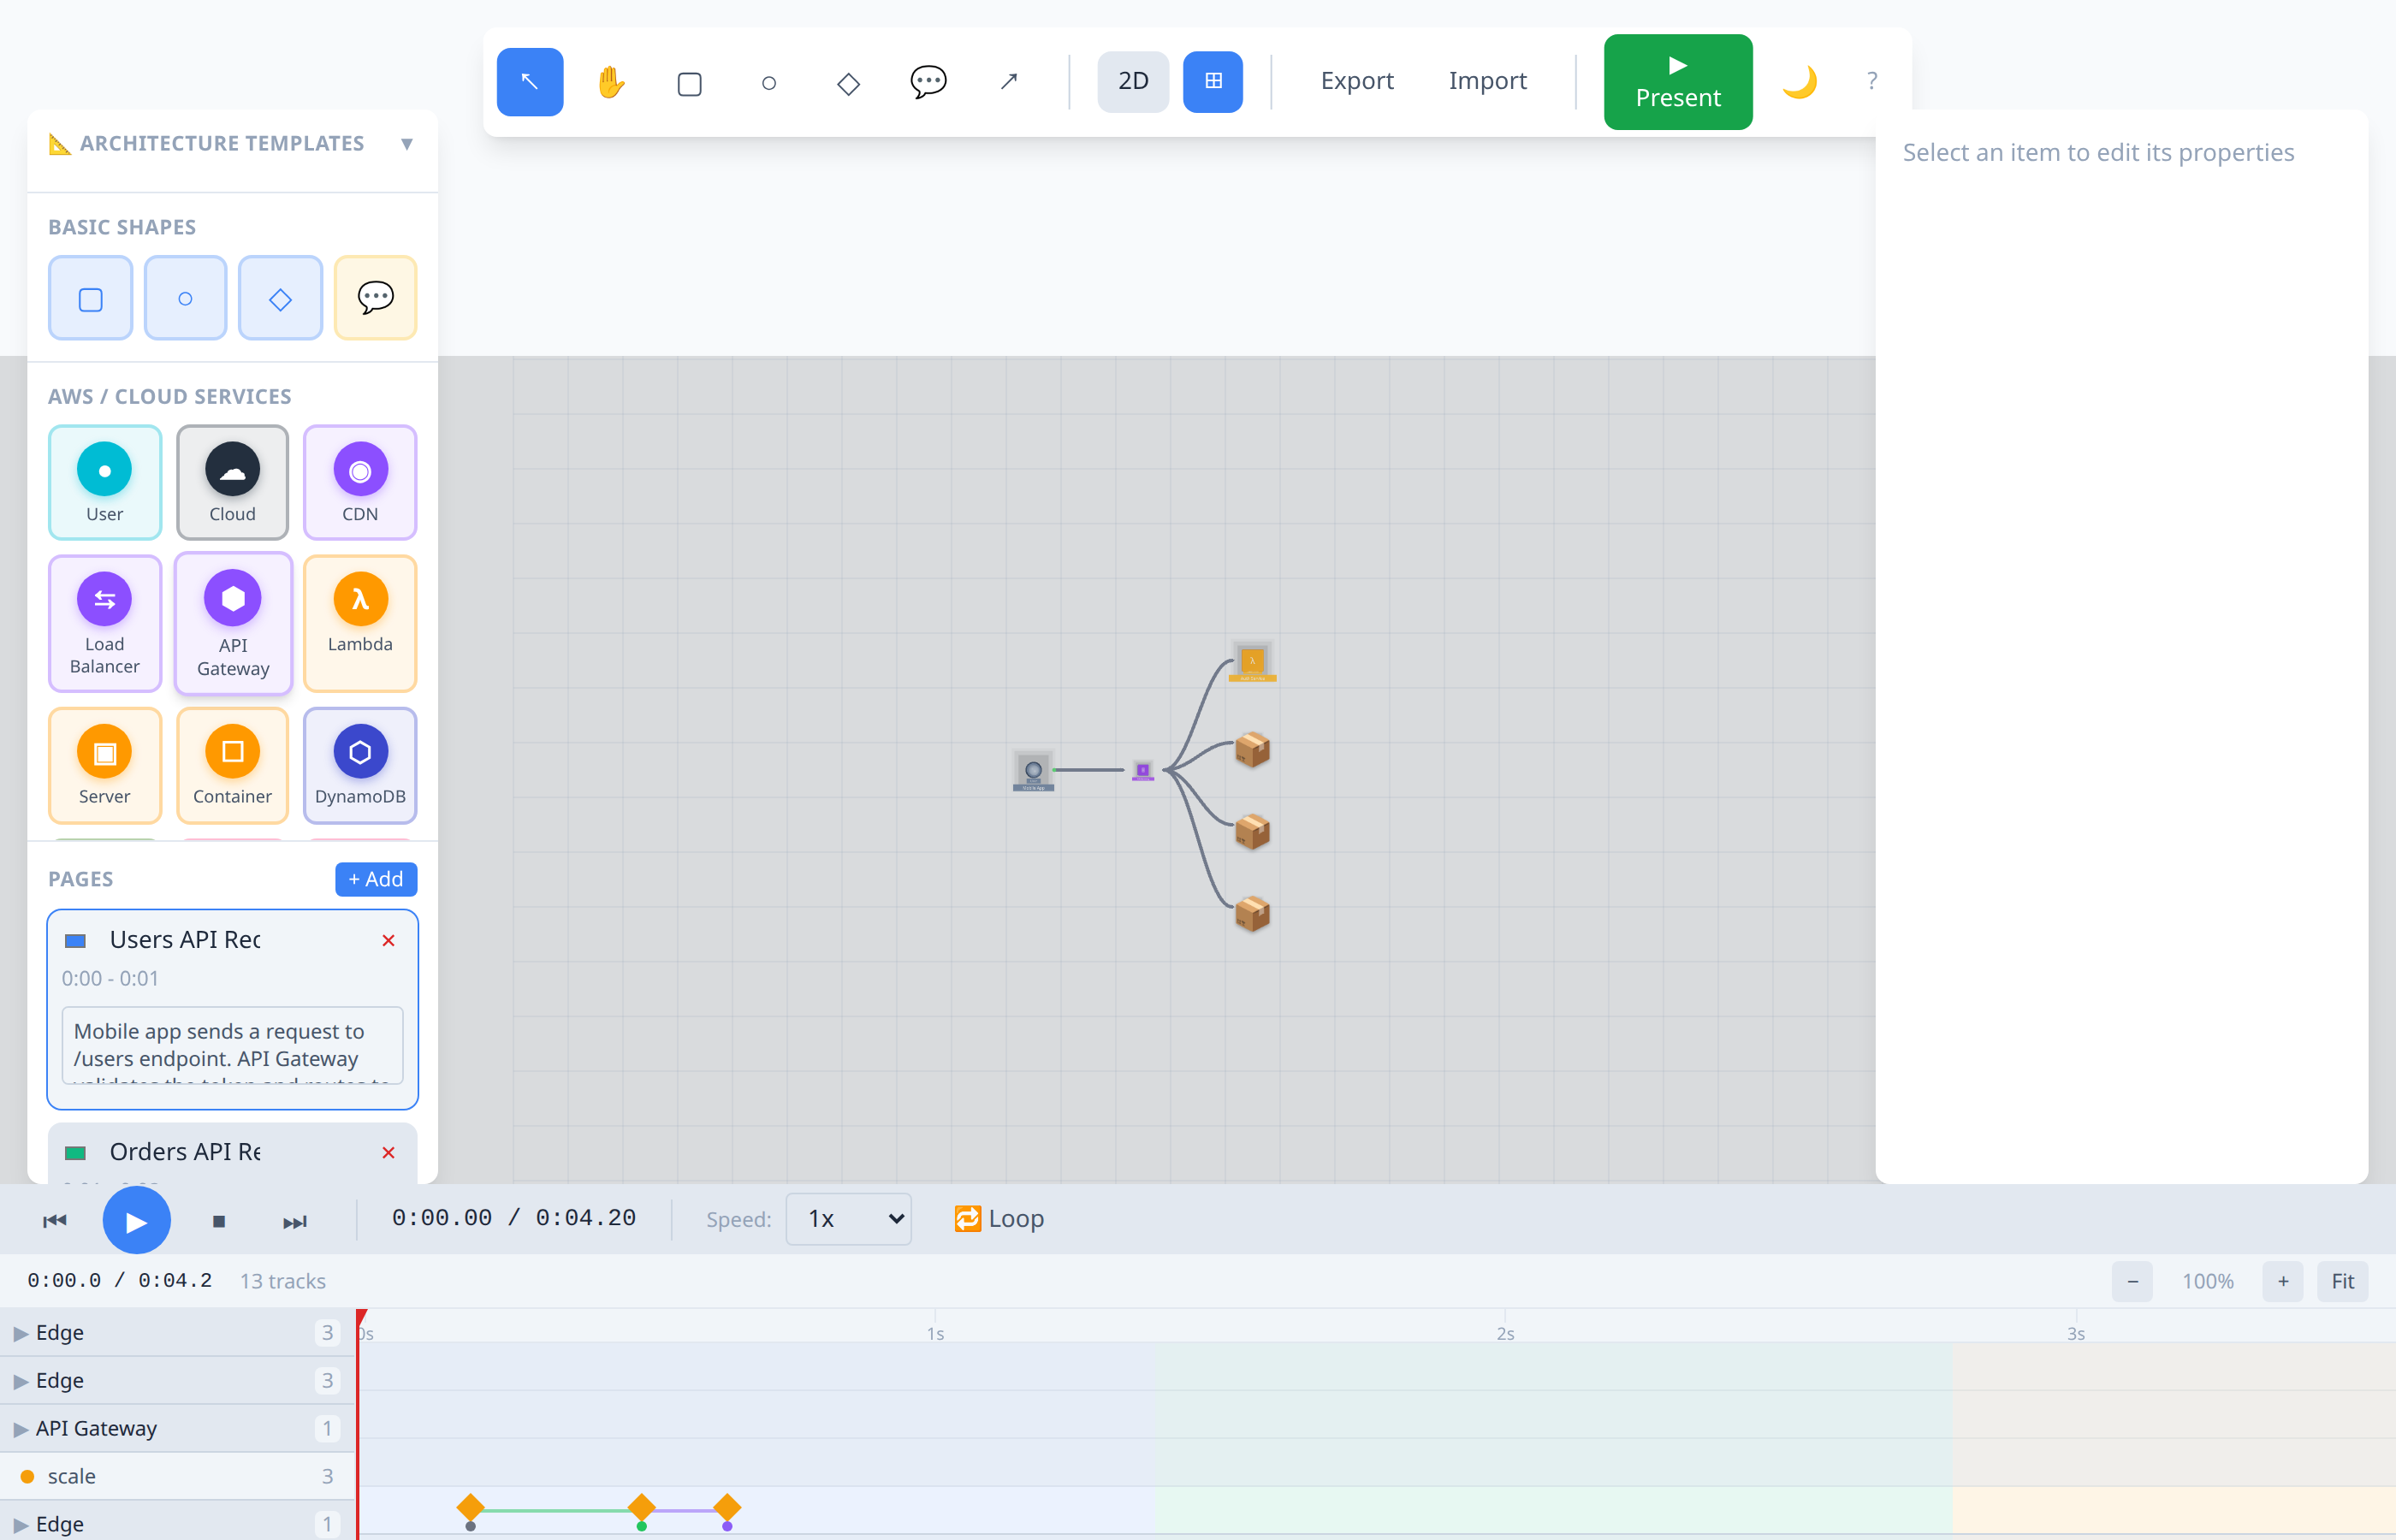
| API Gateway | REST API routing to microservices |
| Serverless | Lambda-based serverless architecture |
| Template | Description |
|---|---|
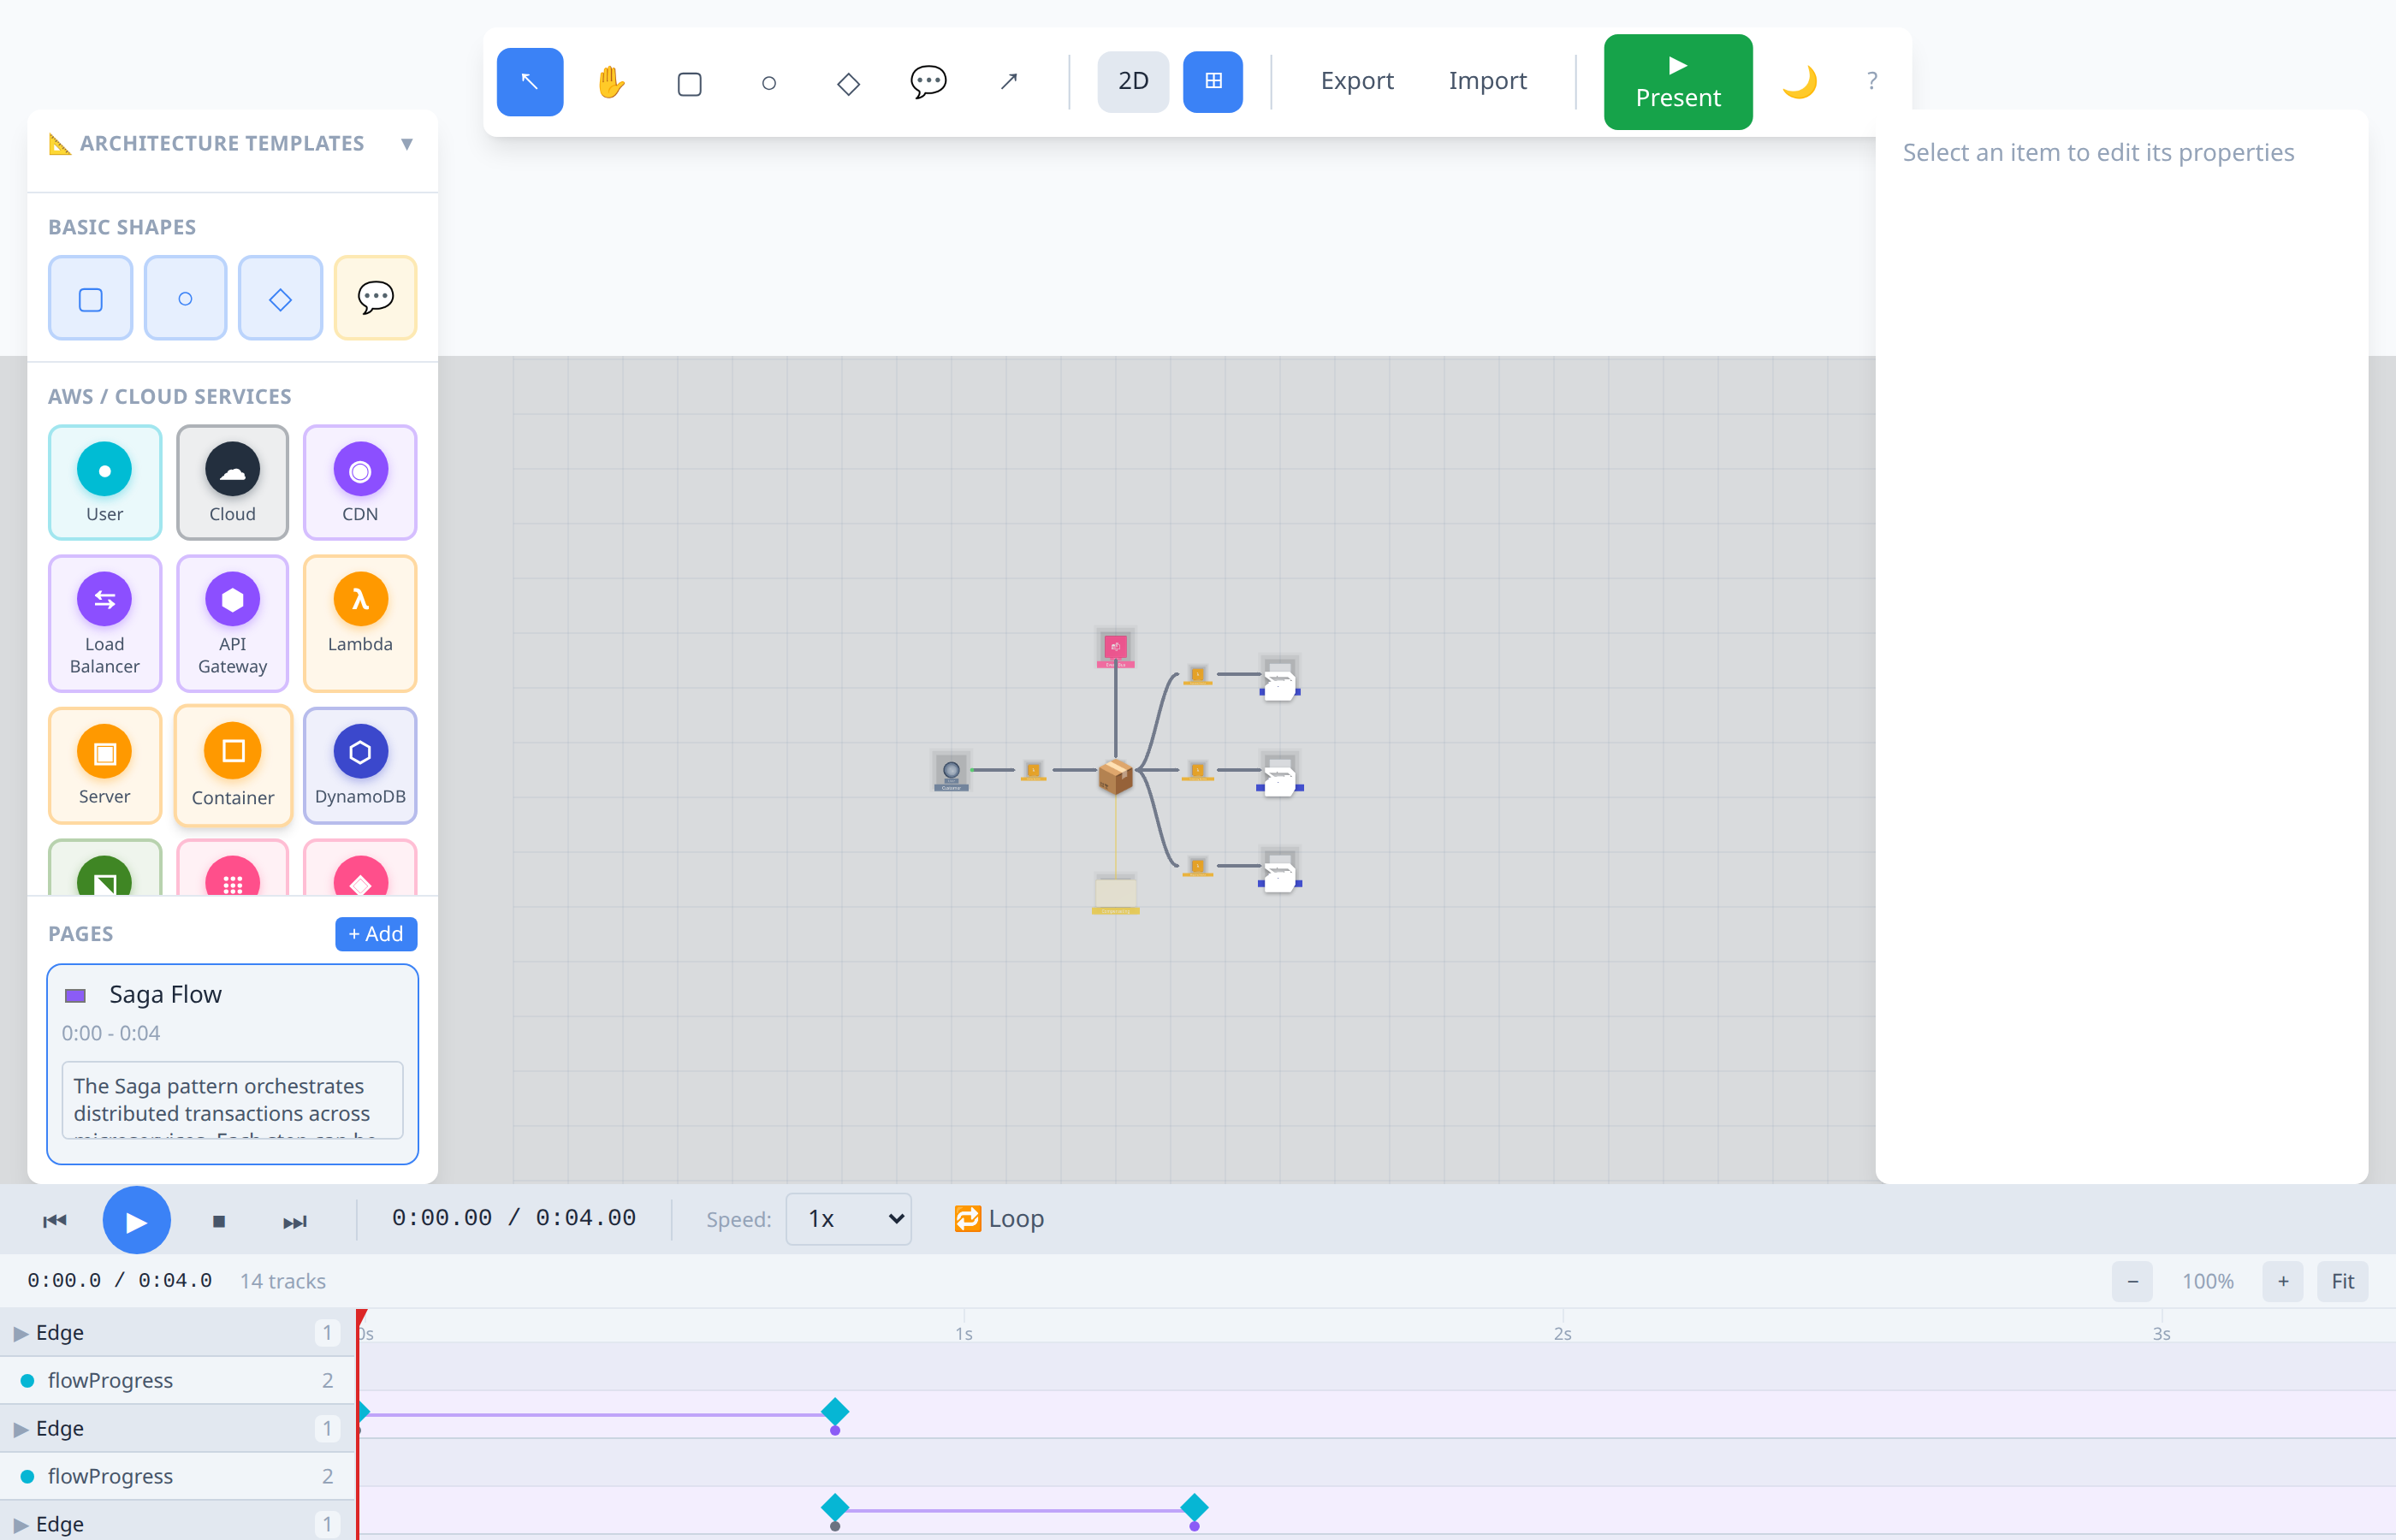
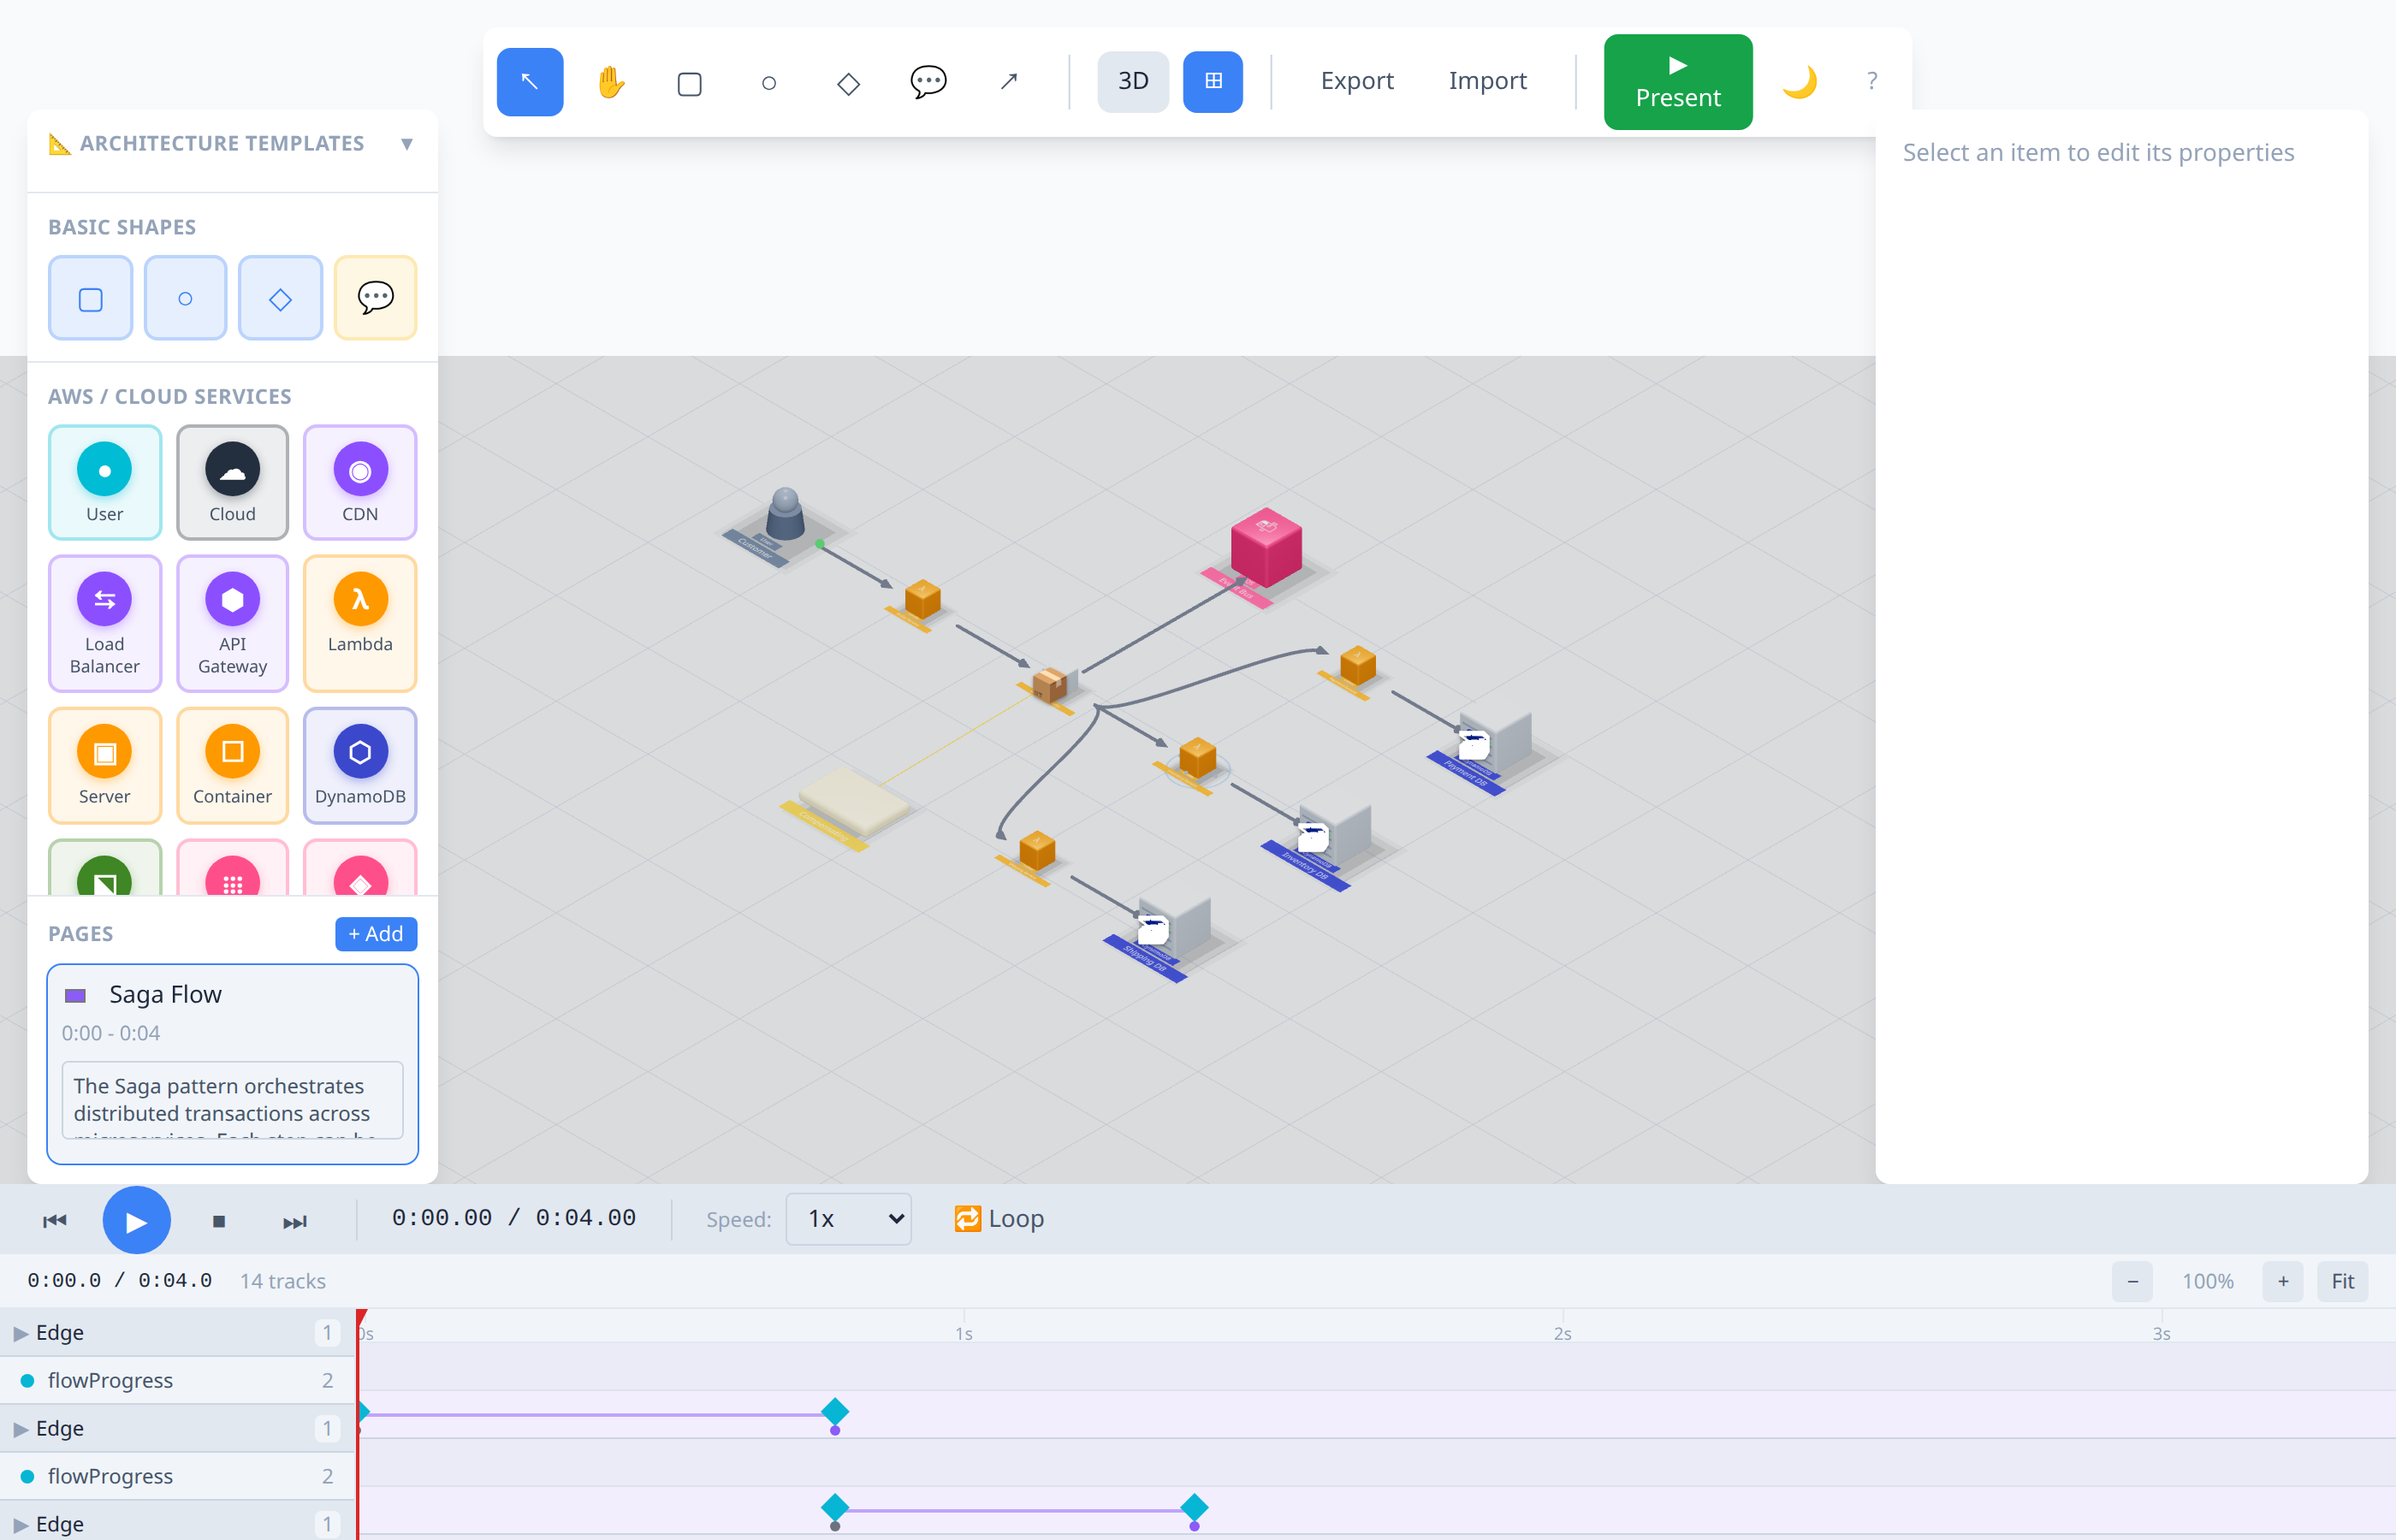
| Saga Pattern | Distributed transactions across microservices |
| Message Queue | Event-driven architecture with queues |
| Database Transactions | ACID compliance and replication |
| Event Sourcing | CQRS pattern with event store |
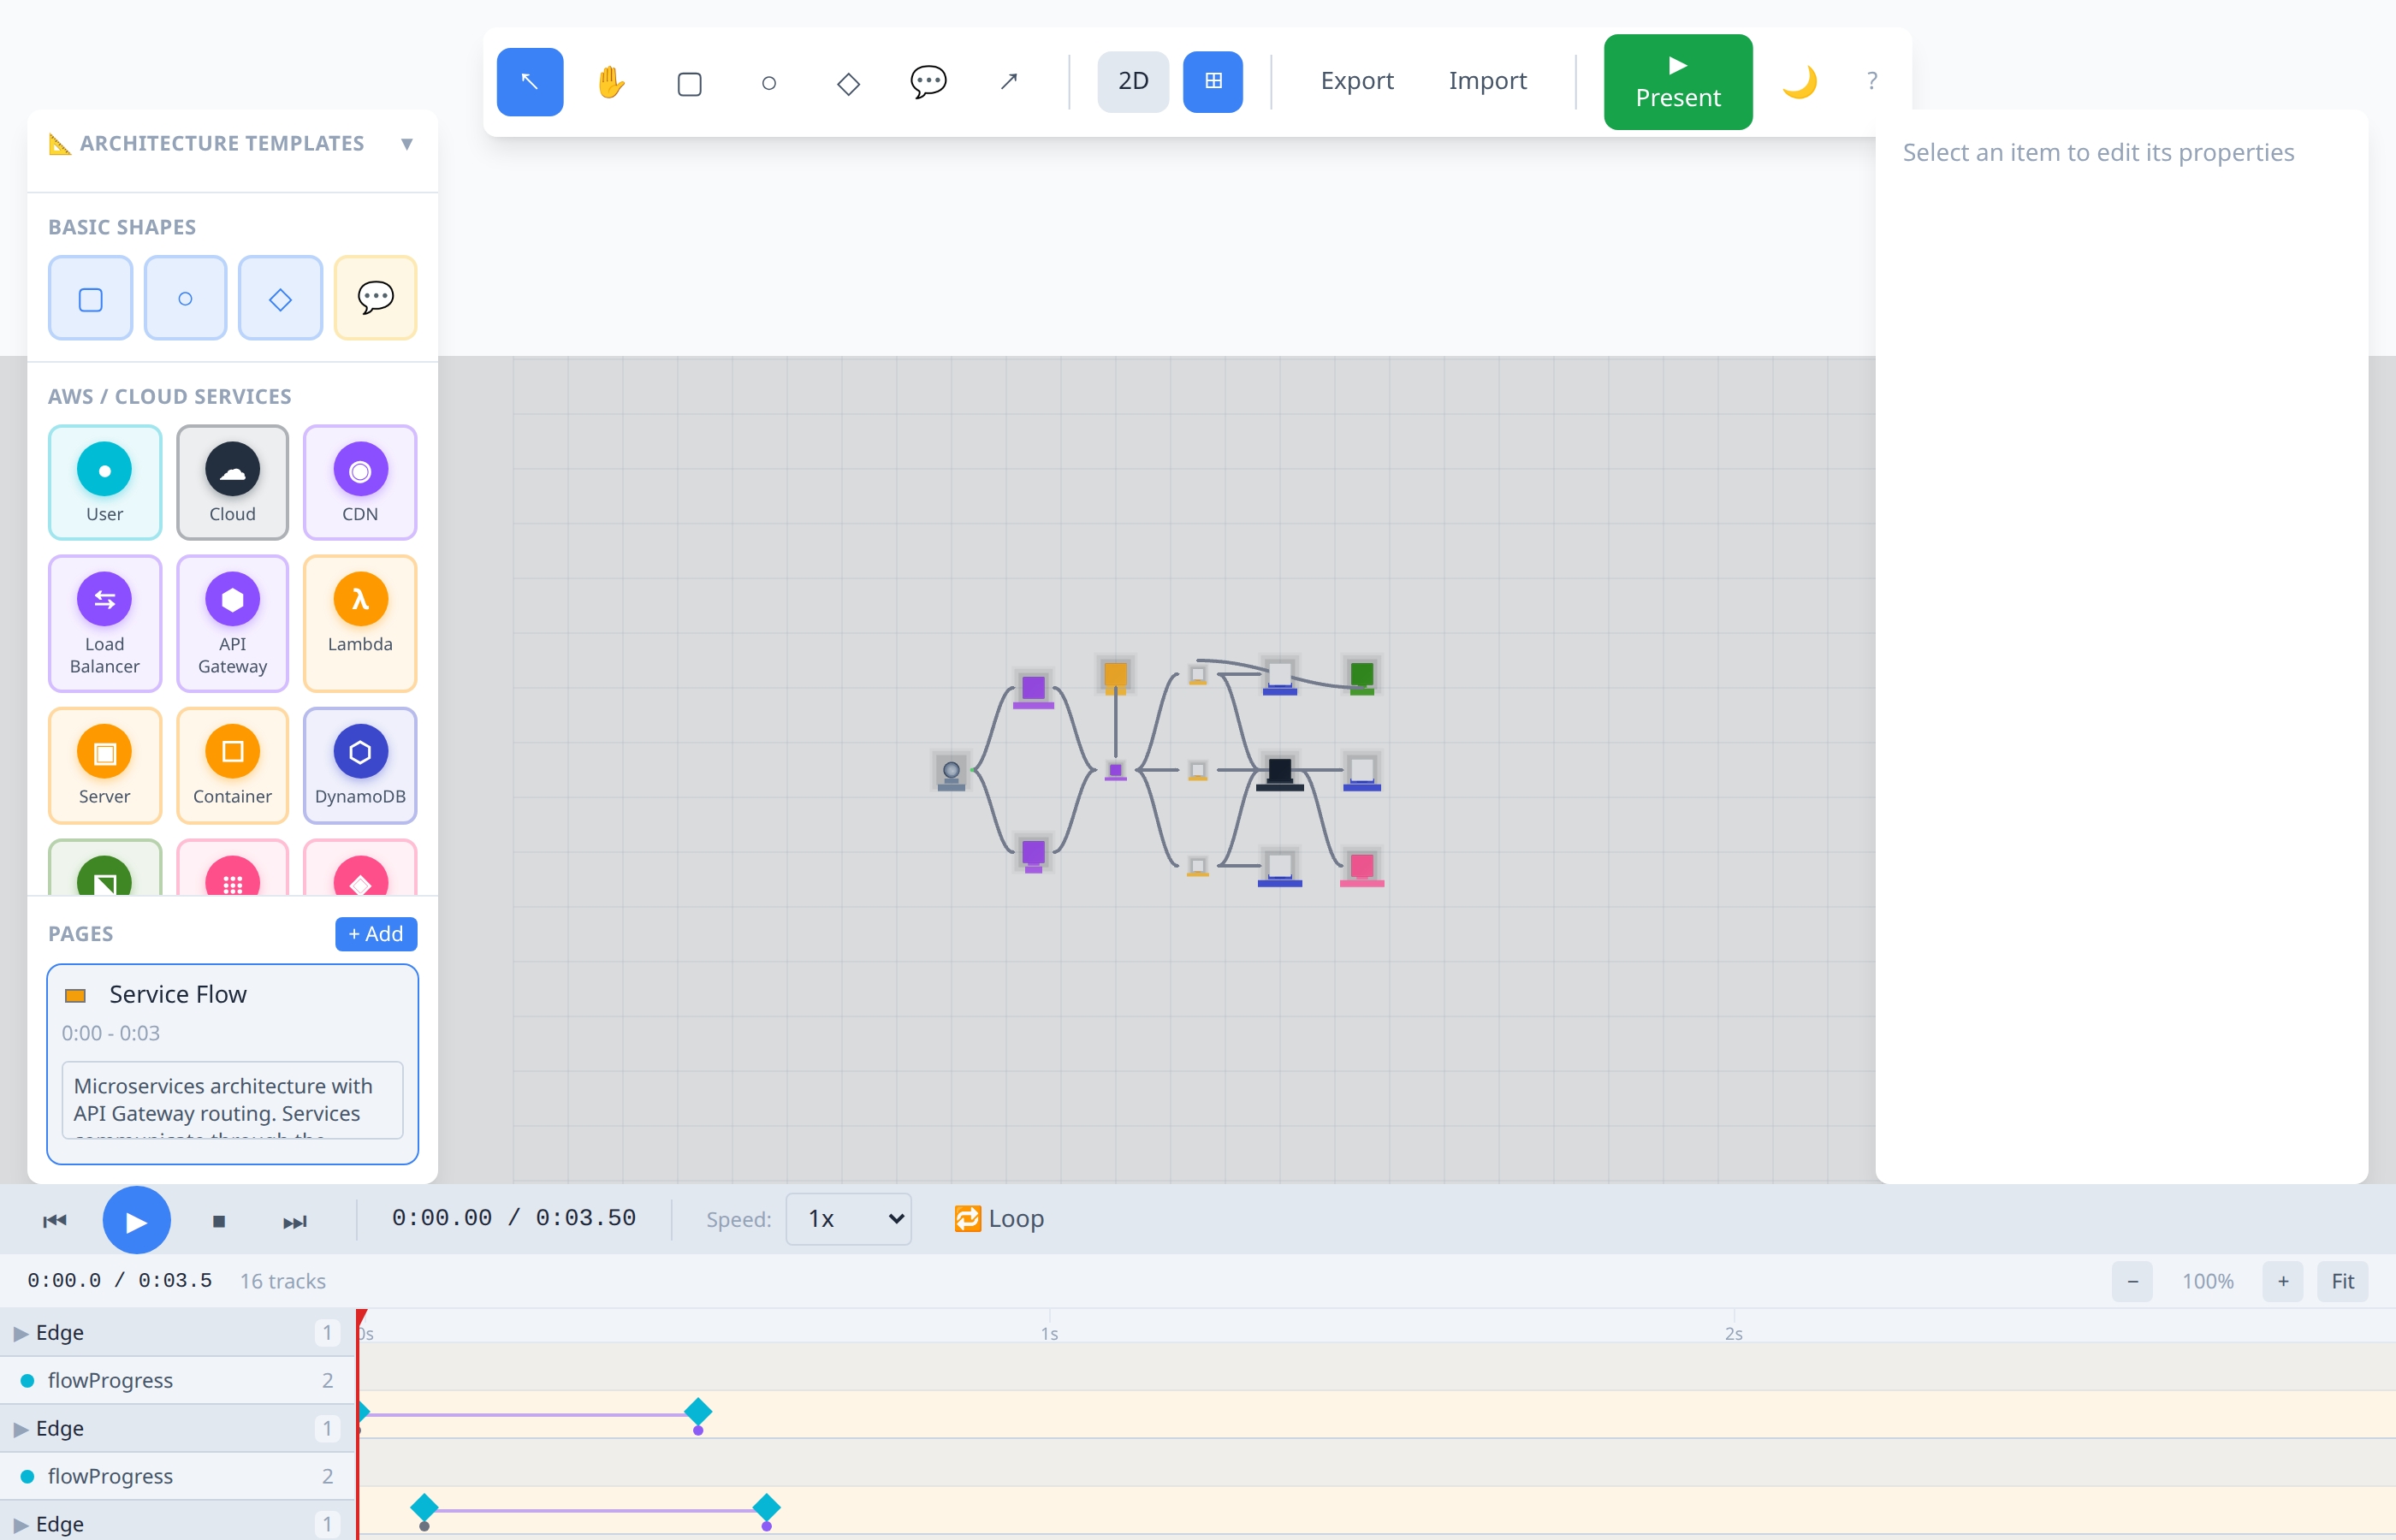
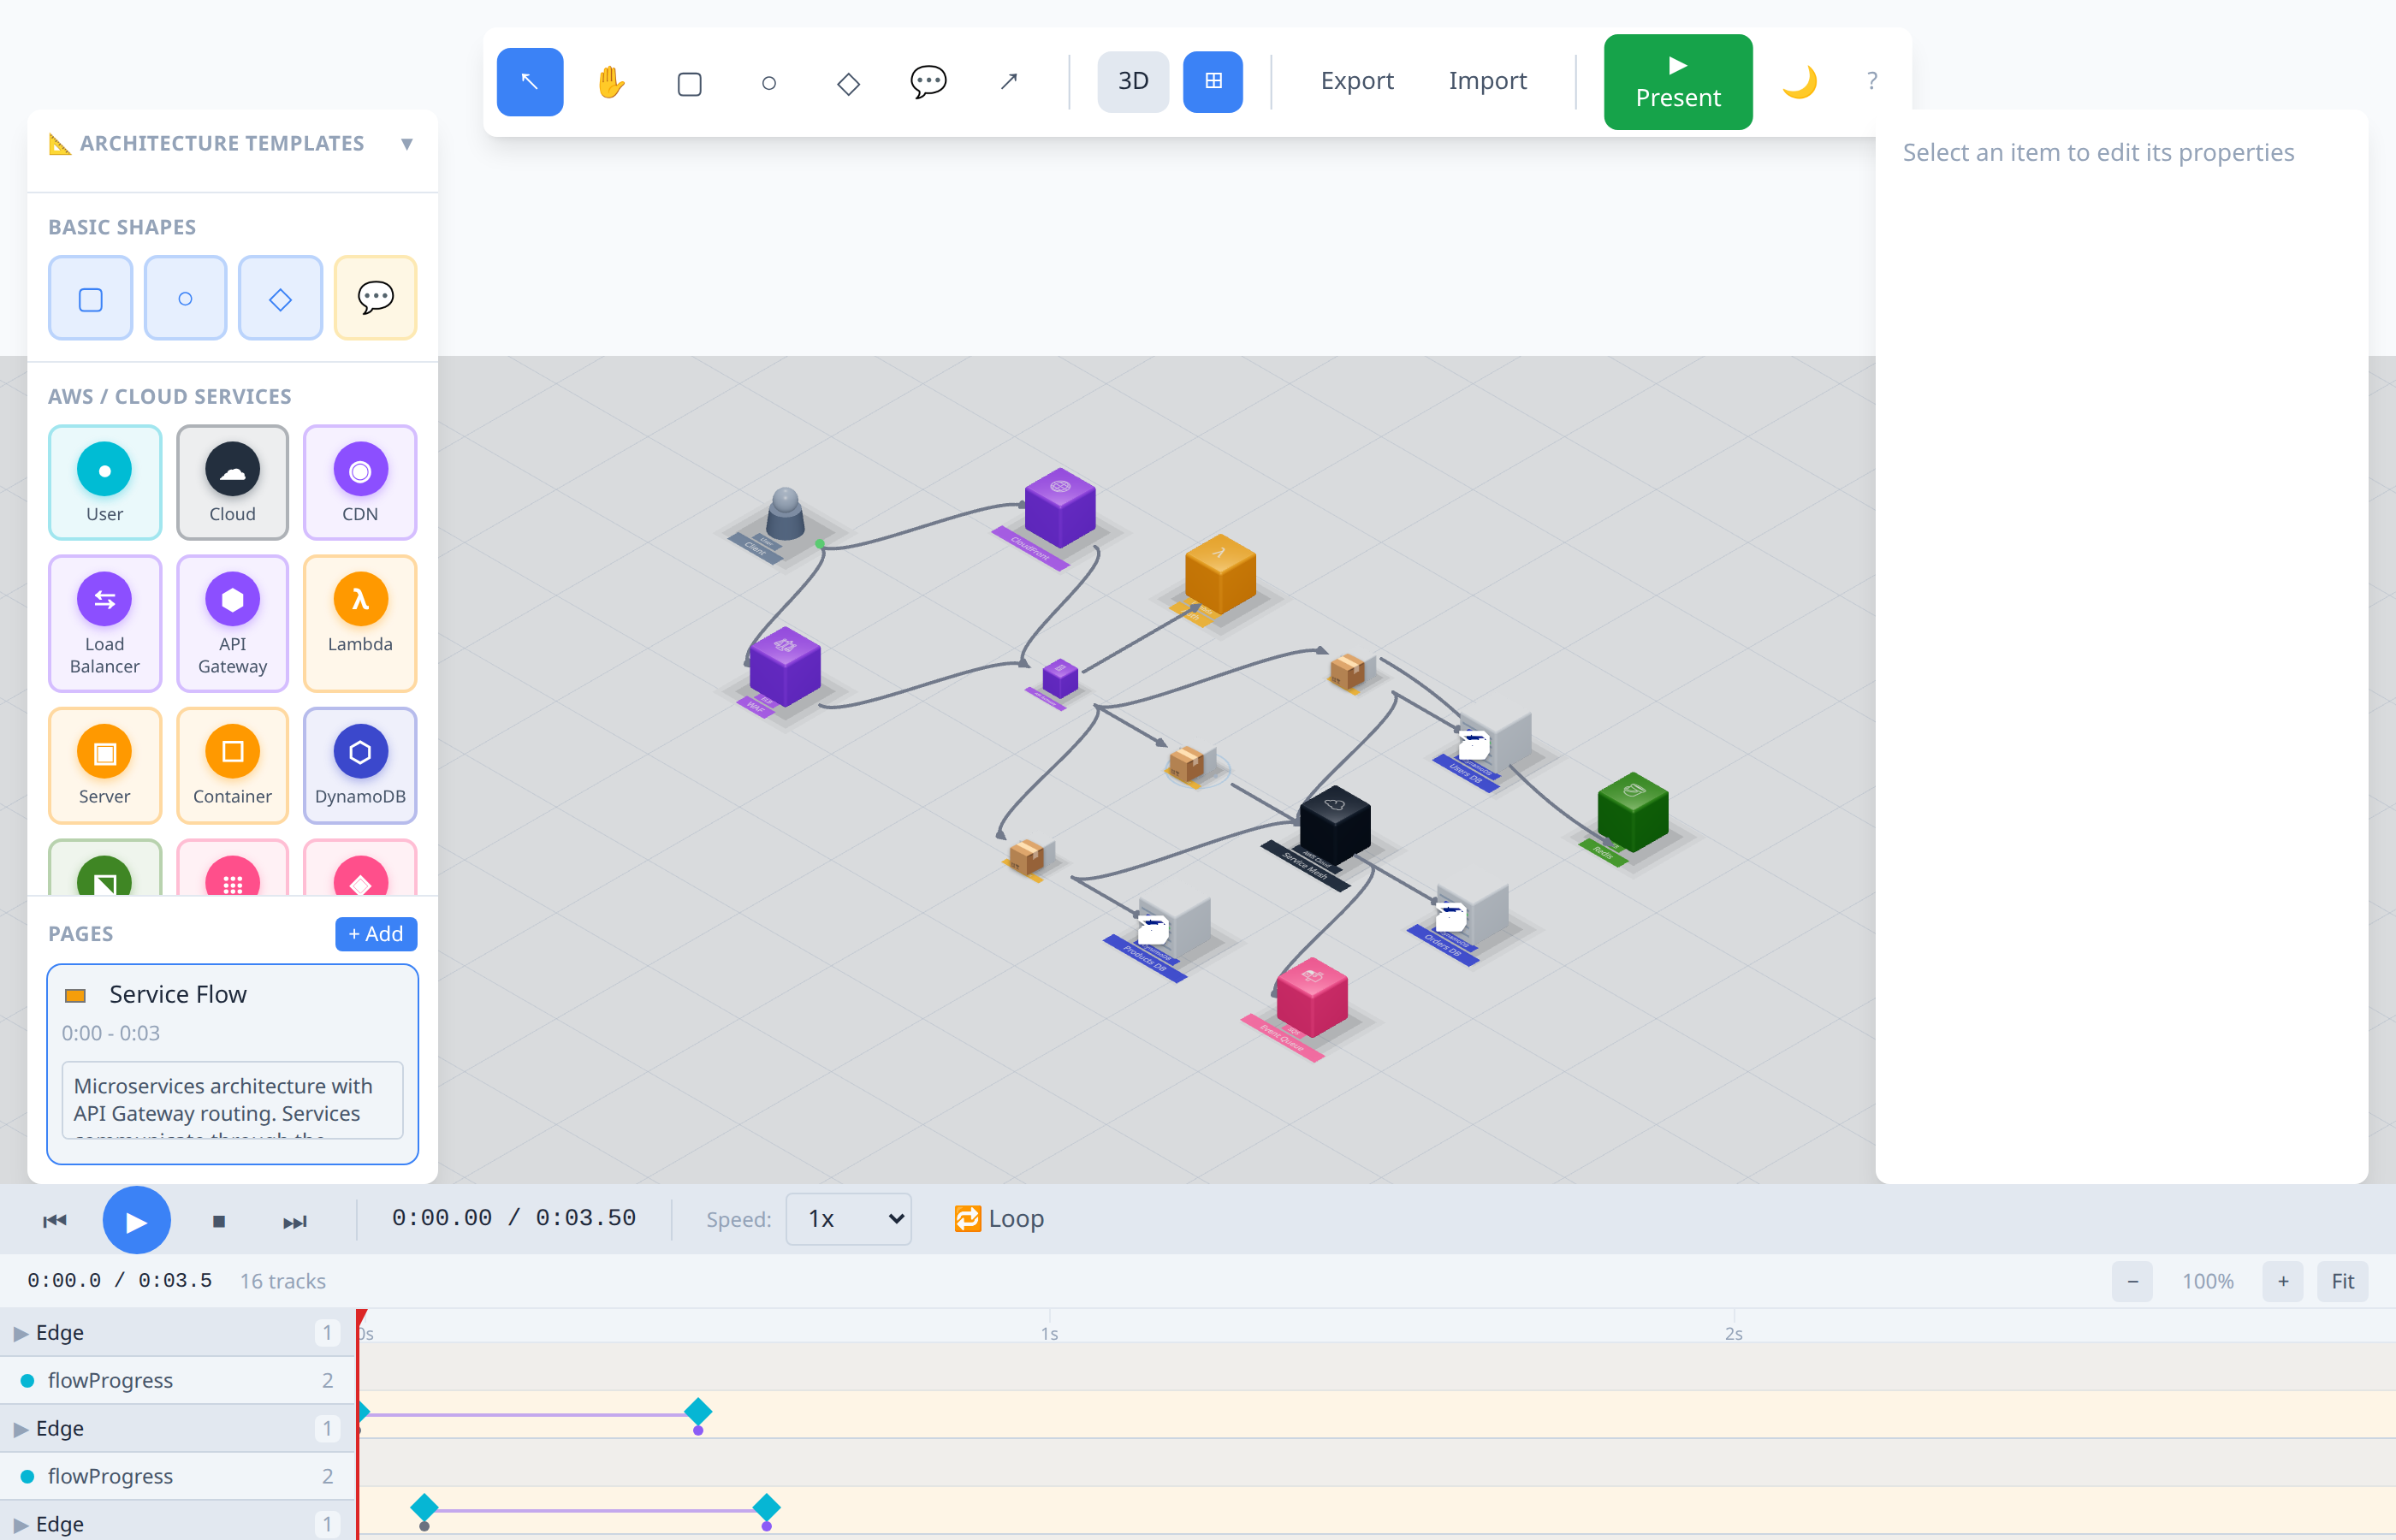
| Microservices | Service mesh with sidecar proxies |
| Circuit Breaker | Resilience pattern for service calls |
| Shadow Proxy | Blue-green deployment migration |
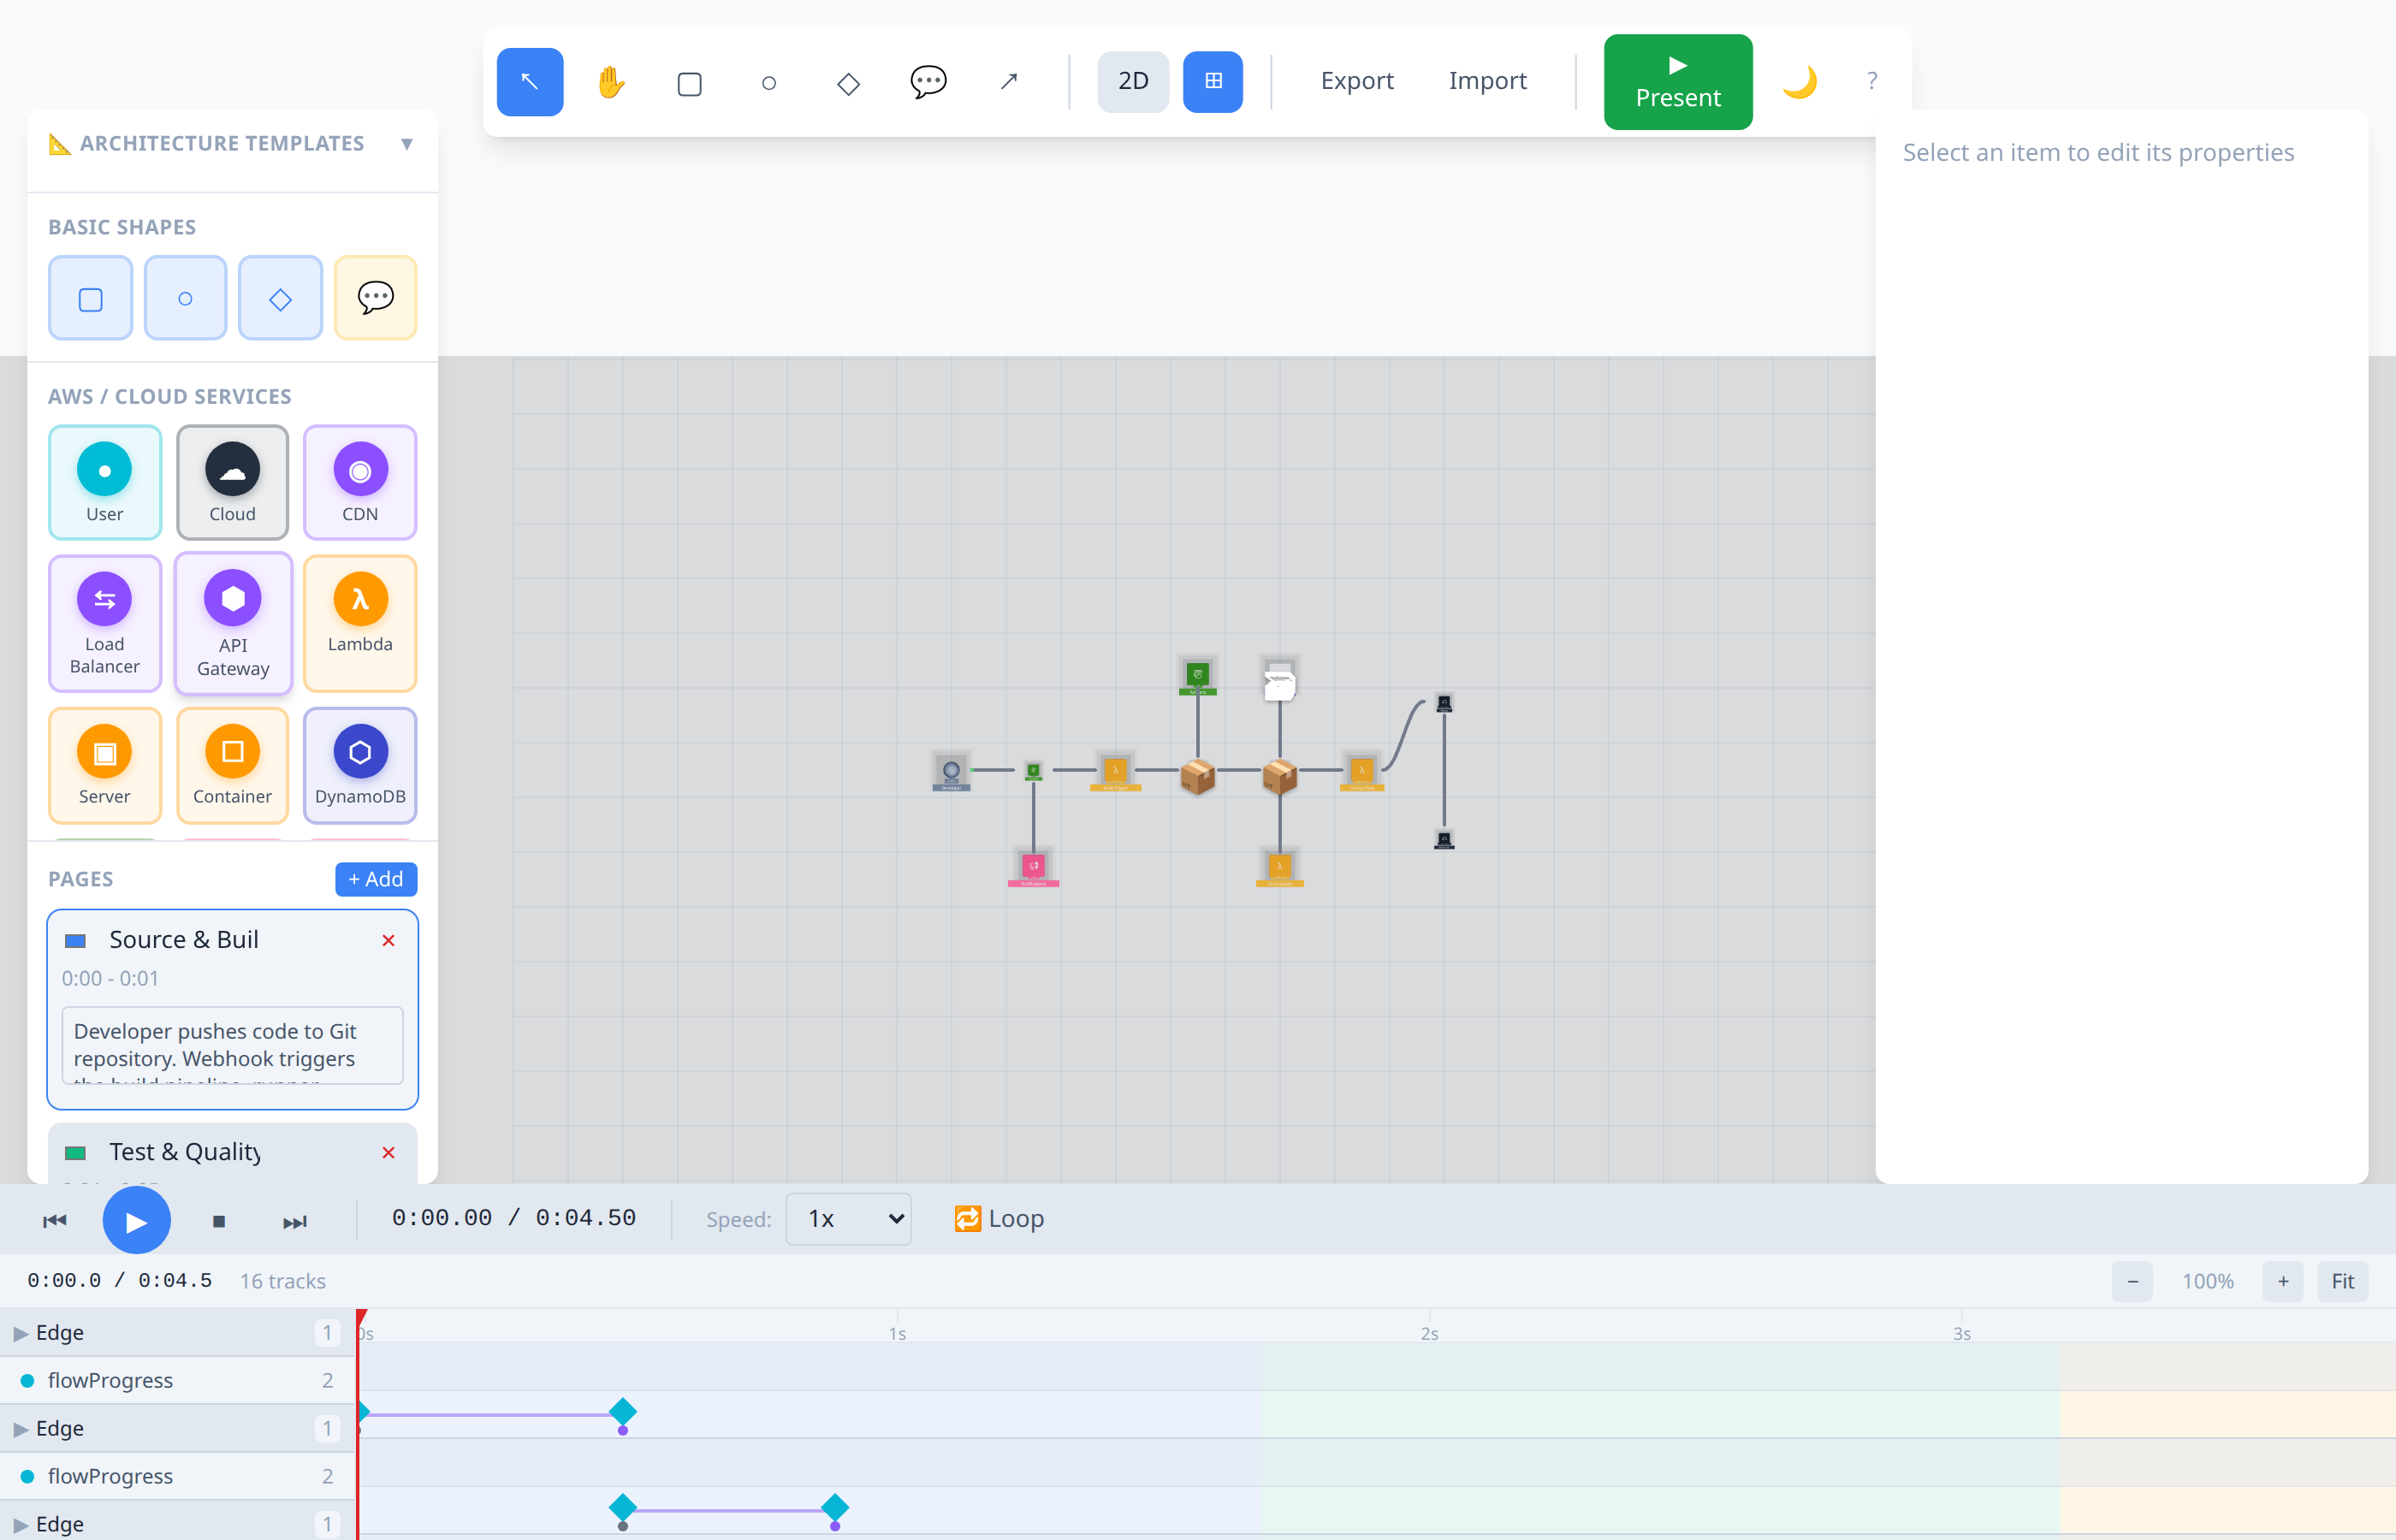
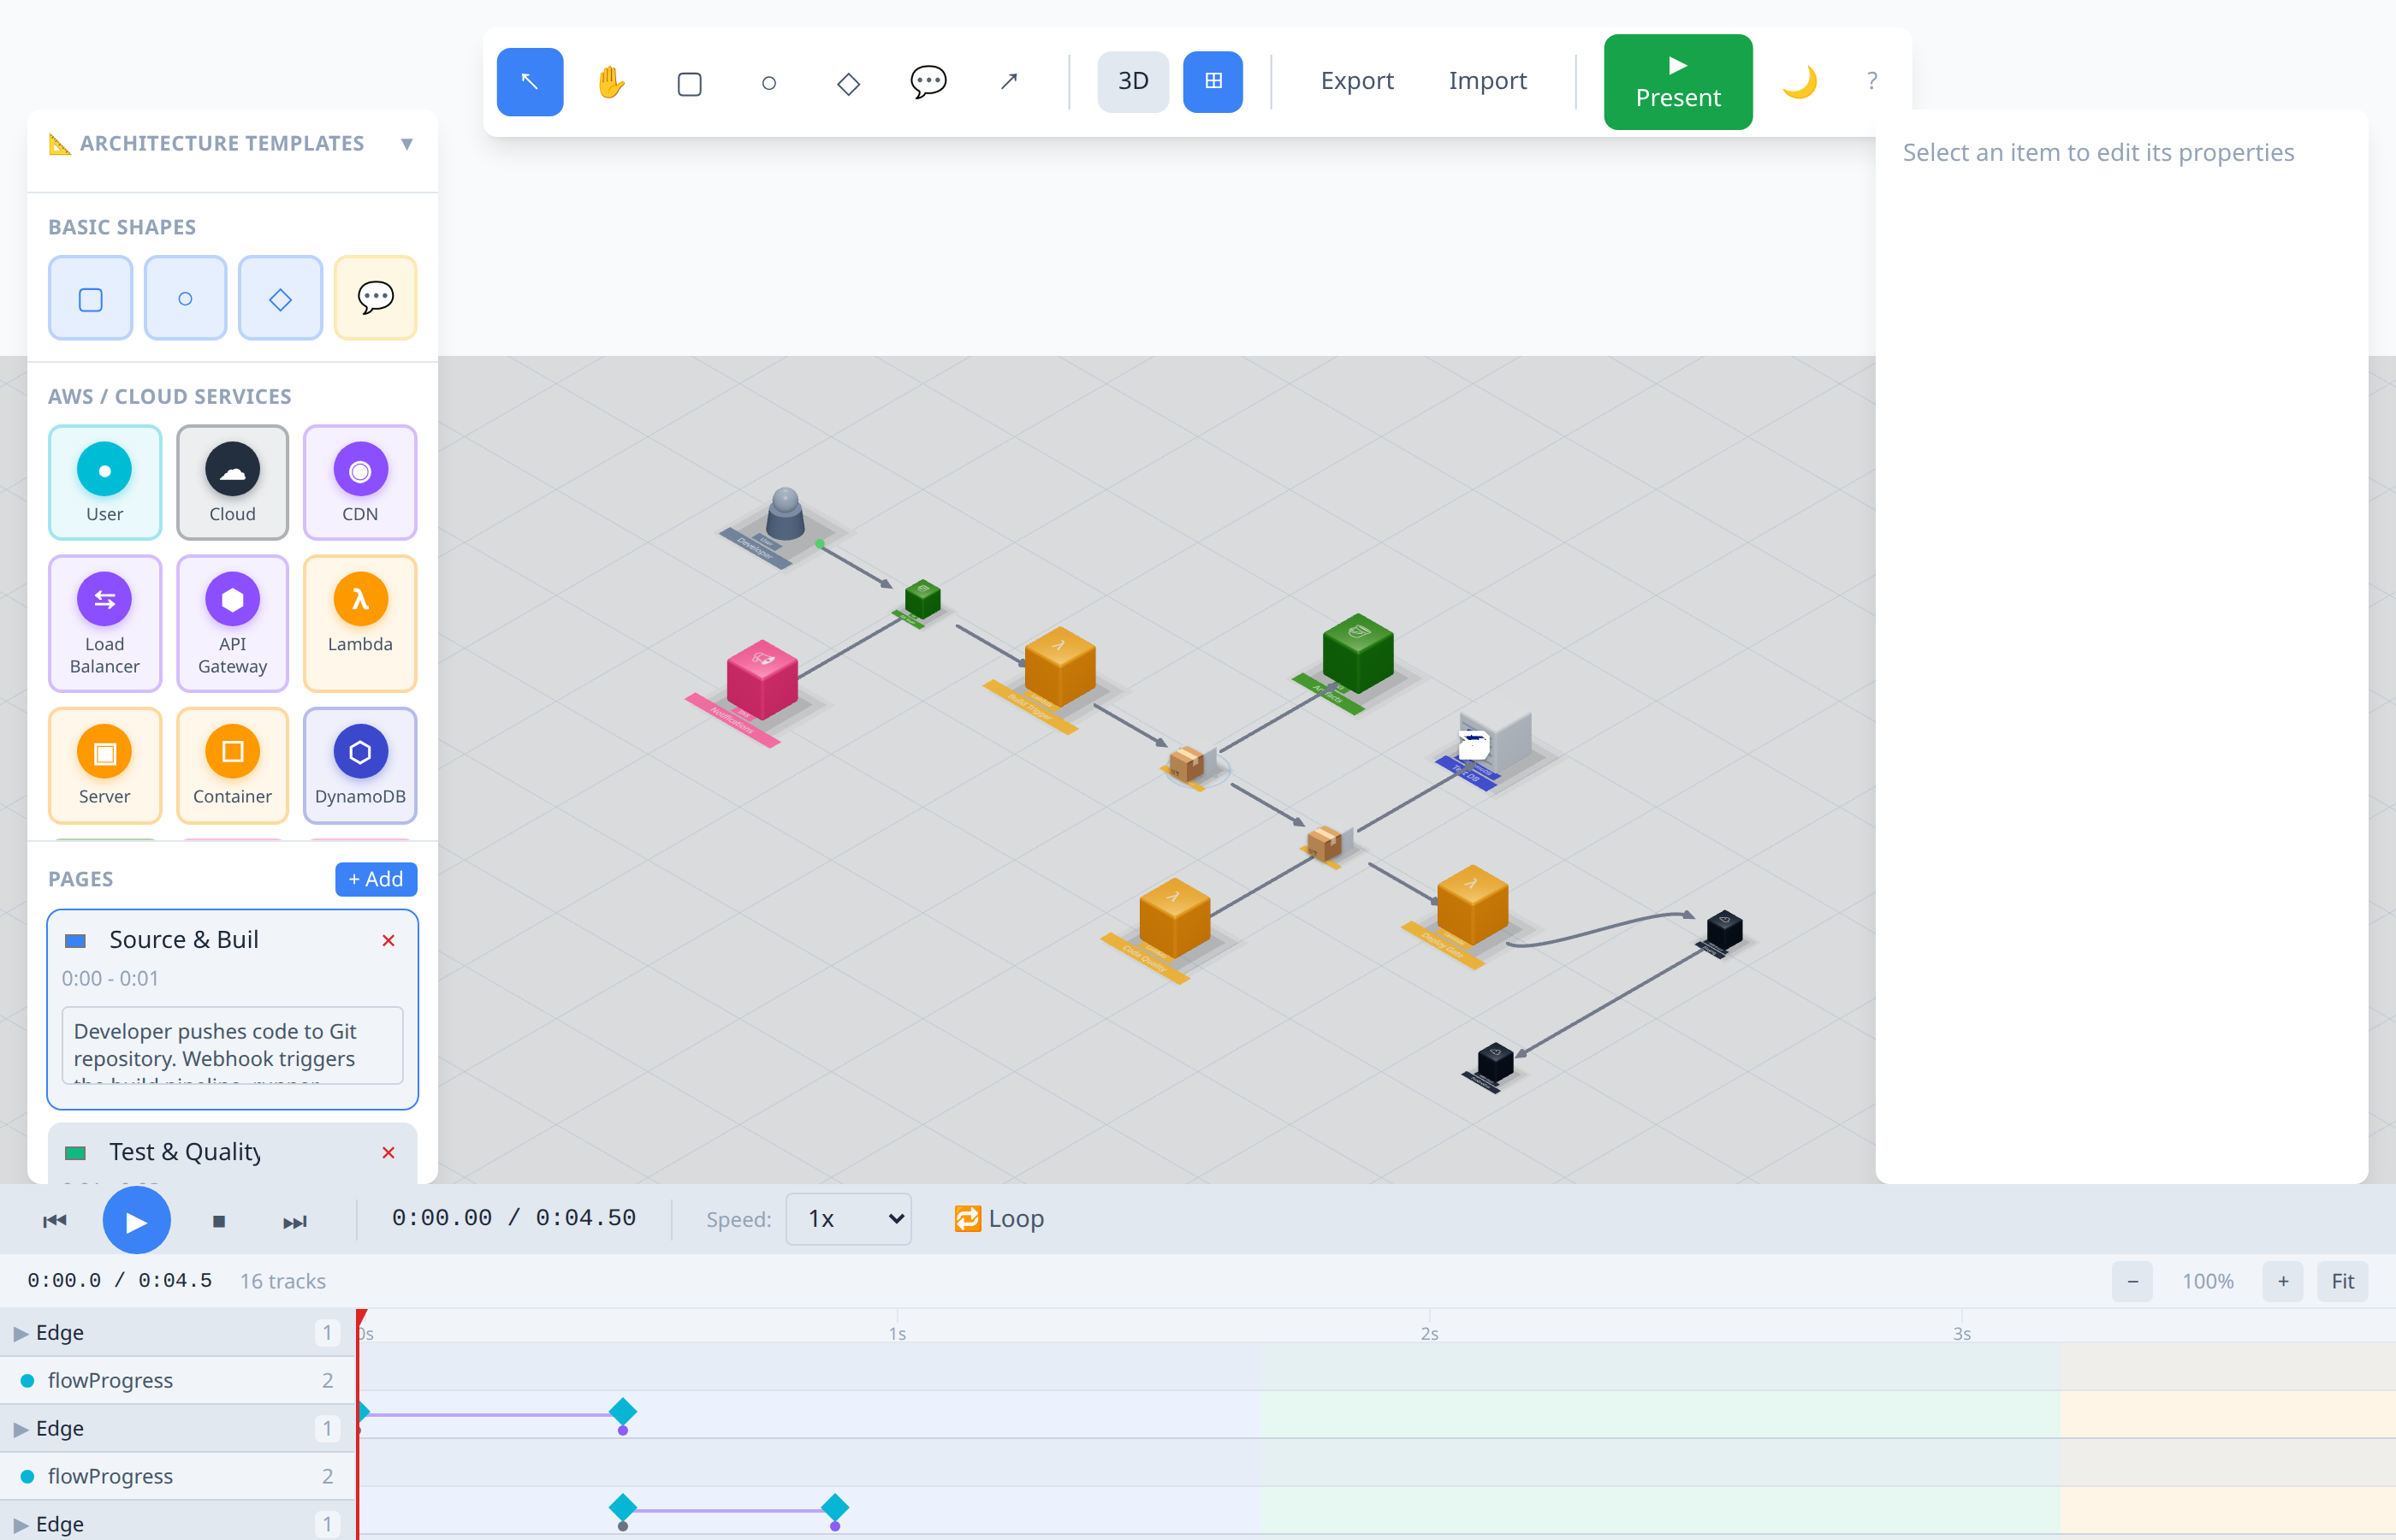
| CI/CD Pipeline | Continuous integration and deployment |
| Kubernetes Cluster | Container orchestration |
| Event-Driven Architecture | Full event-driven system |
| Data Pipeline | ETL/ELT data processing flow |
Template Examples
API Gateway Pattern:
Saga Pattern (Distributed Transactions):
Microservices (Service Mesh):
CI/CD Pipeline:
Data Pipeline (ETL/ELT):
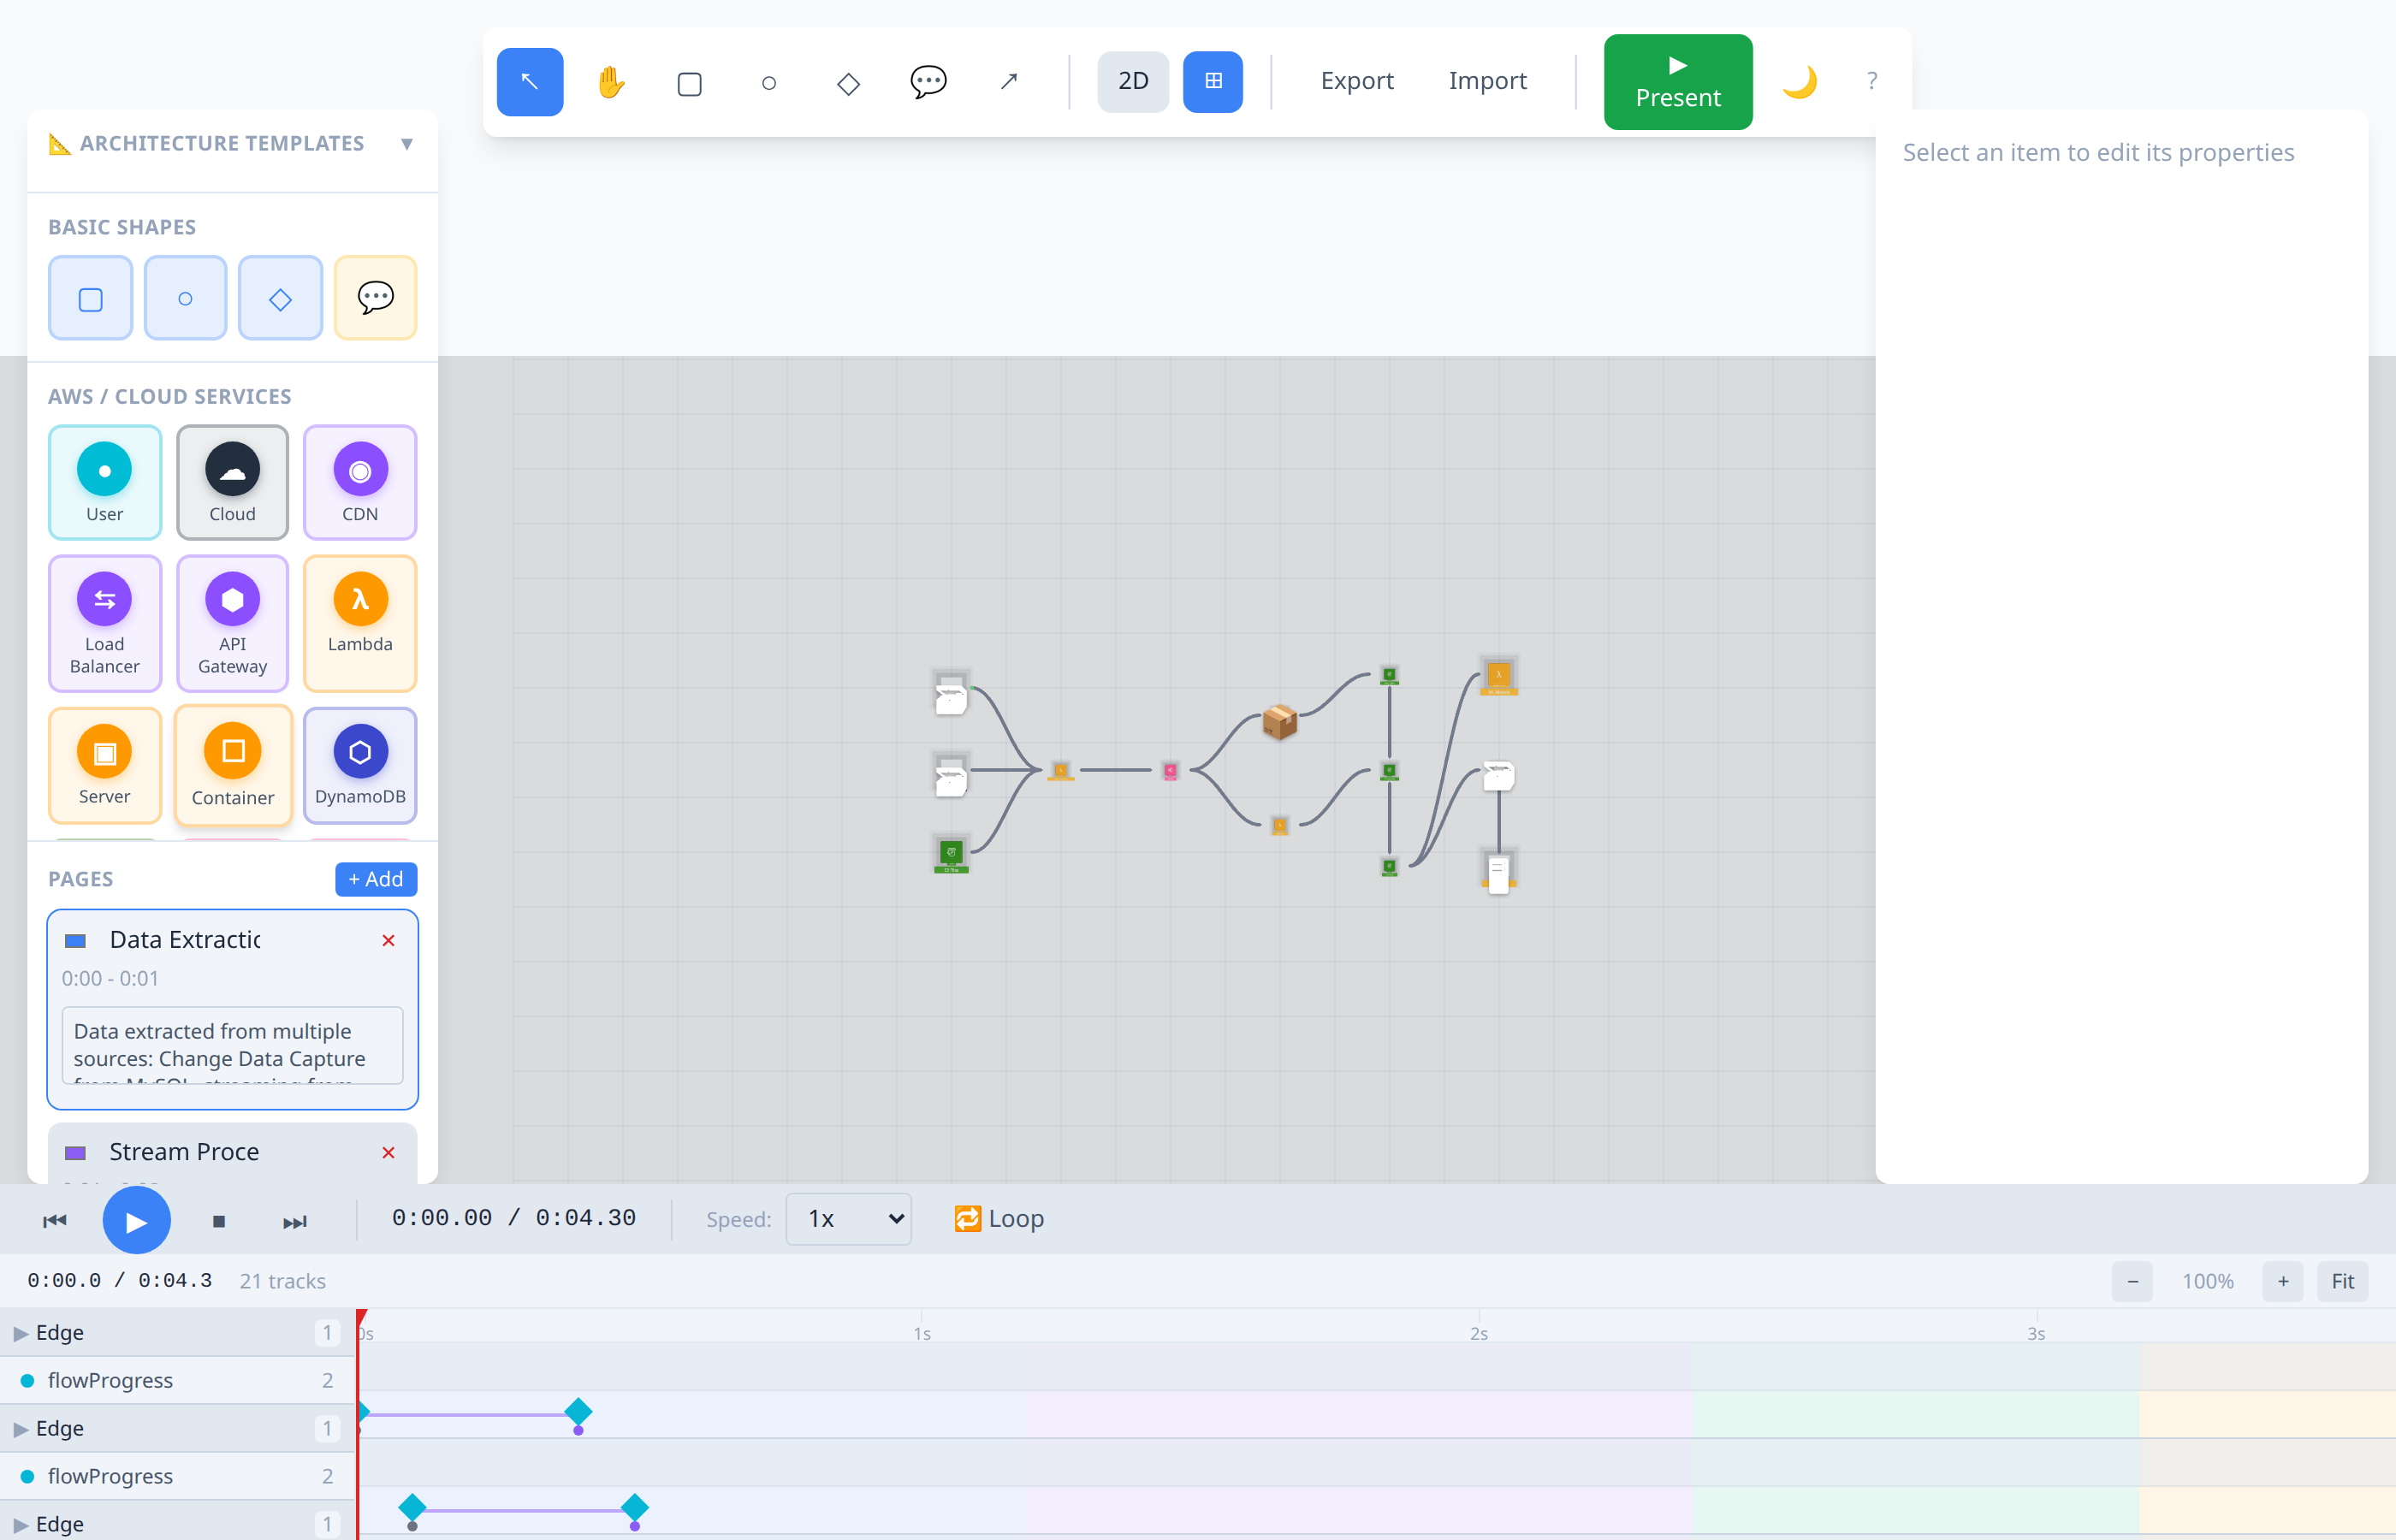
3D Isometric Template Gallery
All templates can be viewed in 3D isometric mode for a more visual, presentation-ready look.
Saga Pattern (3D):
Microservices (3D):
CI/CD Pipeline (3D):
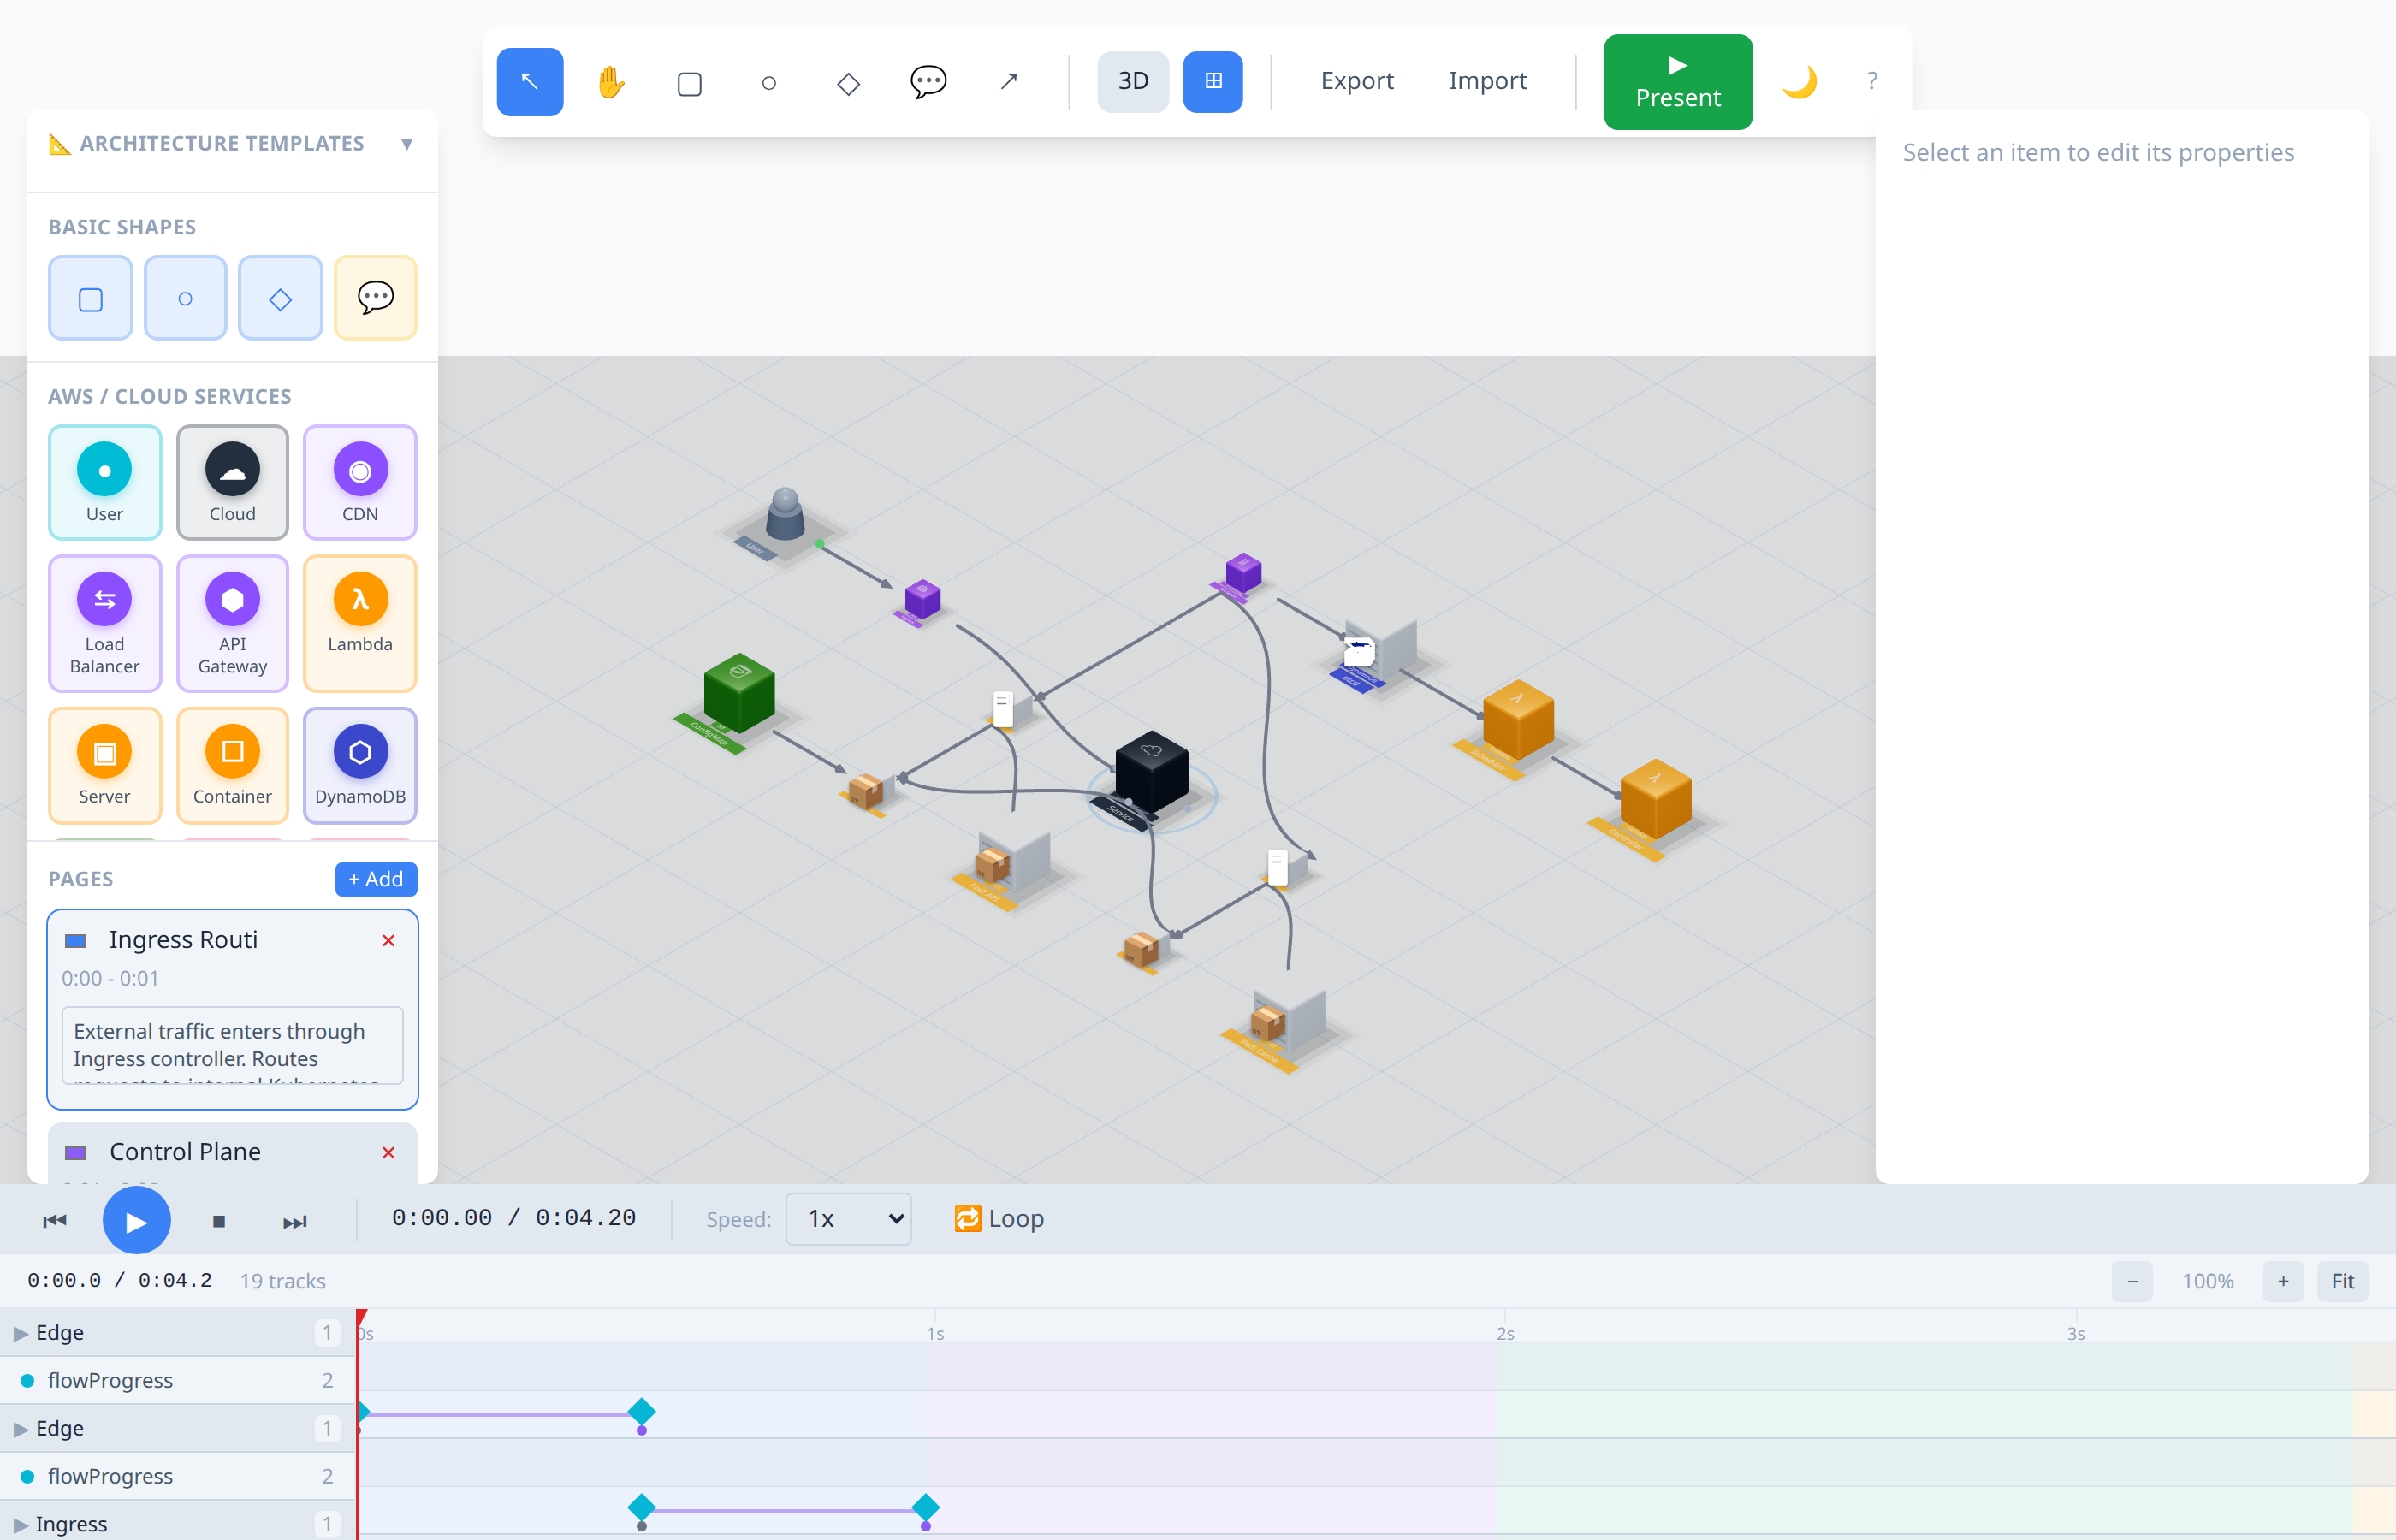
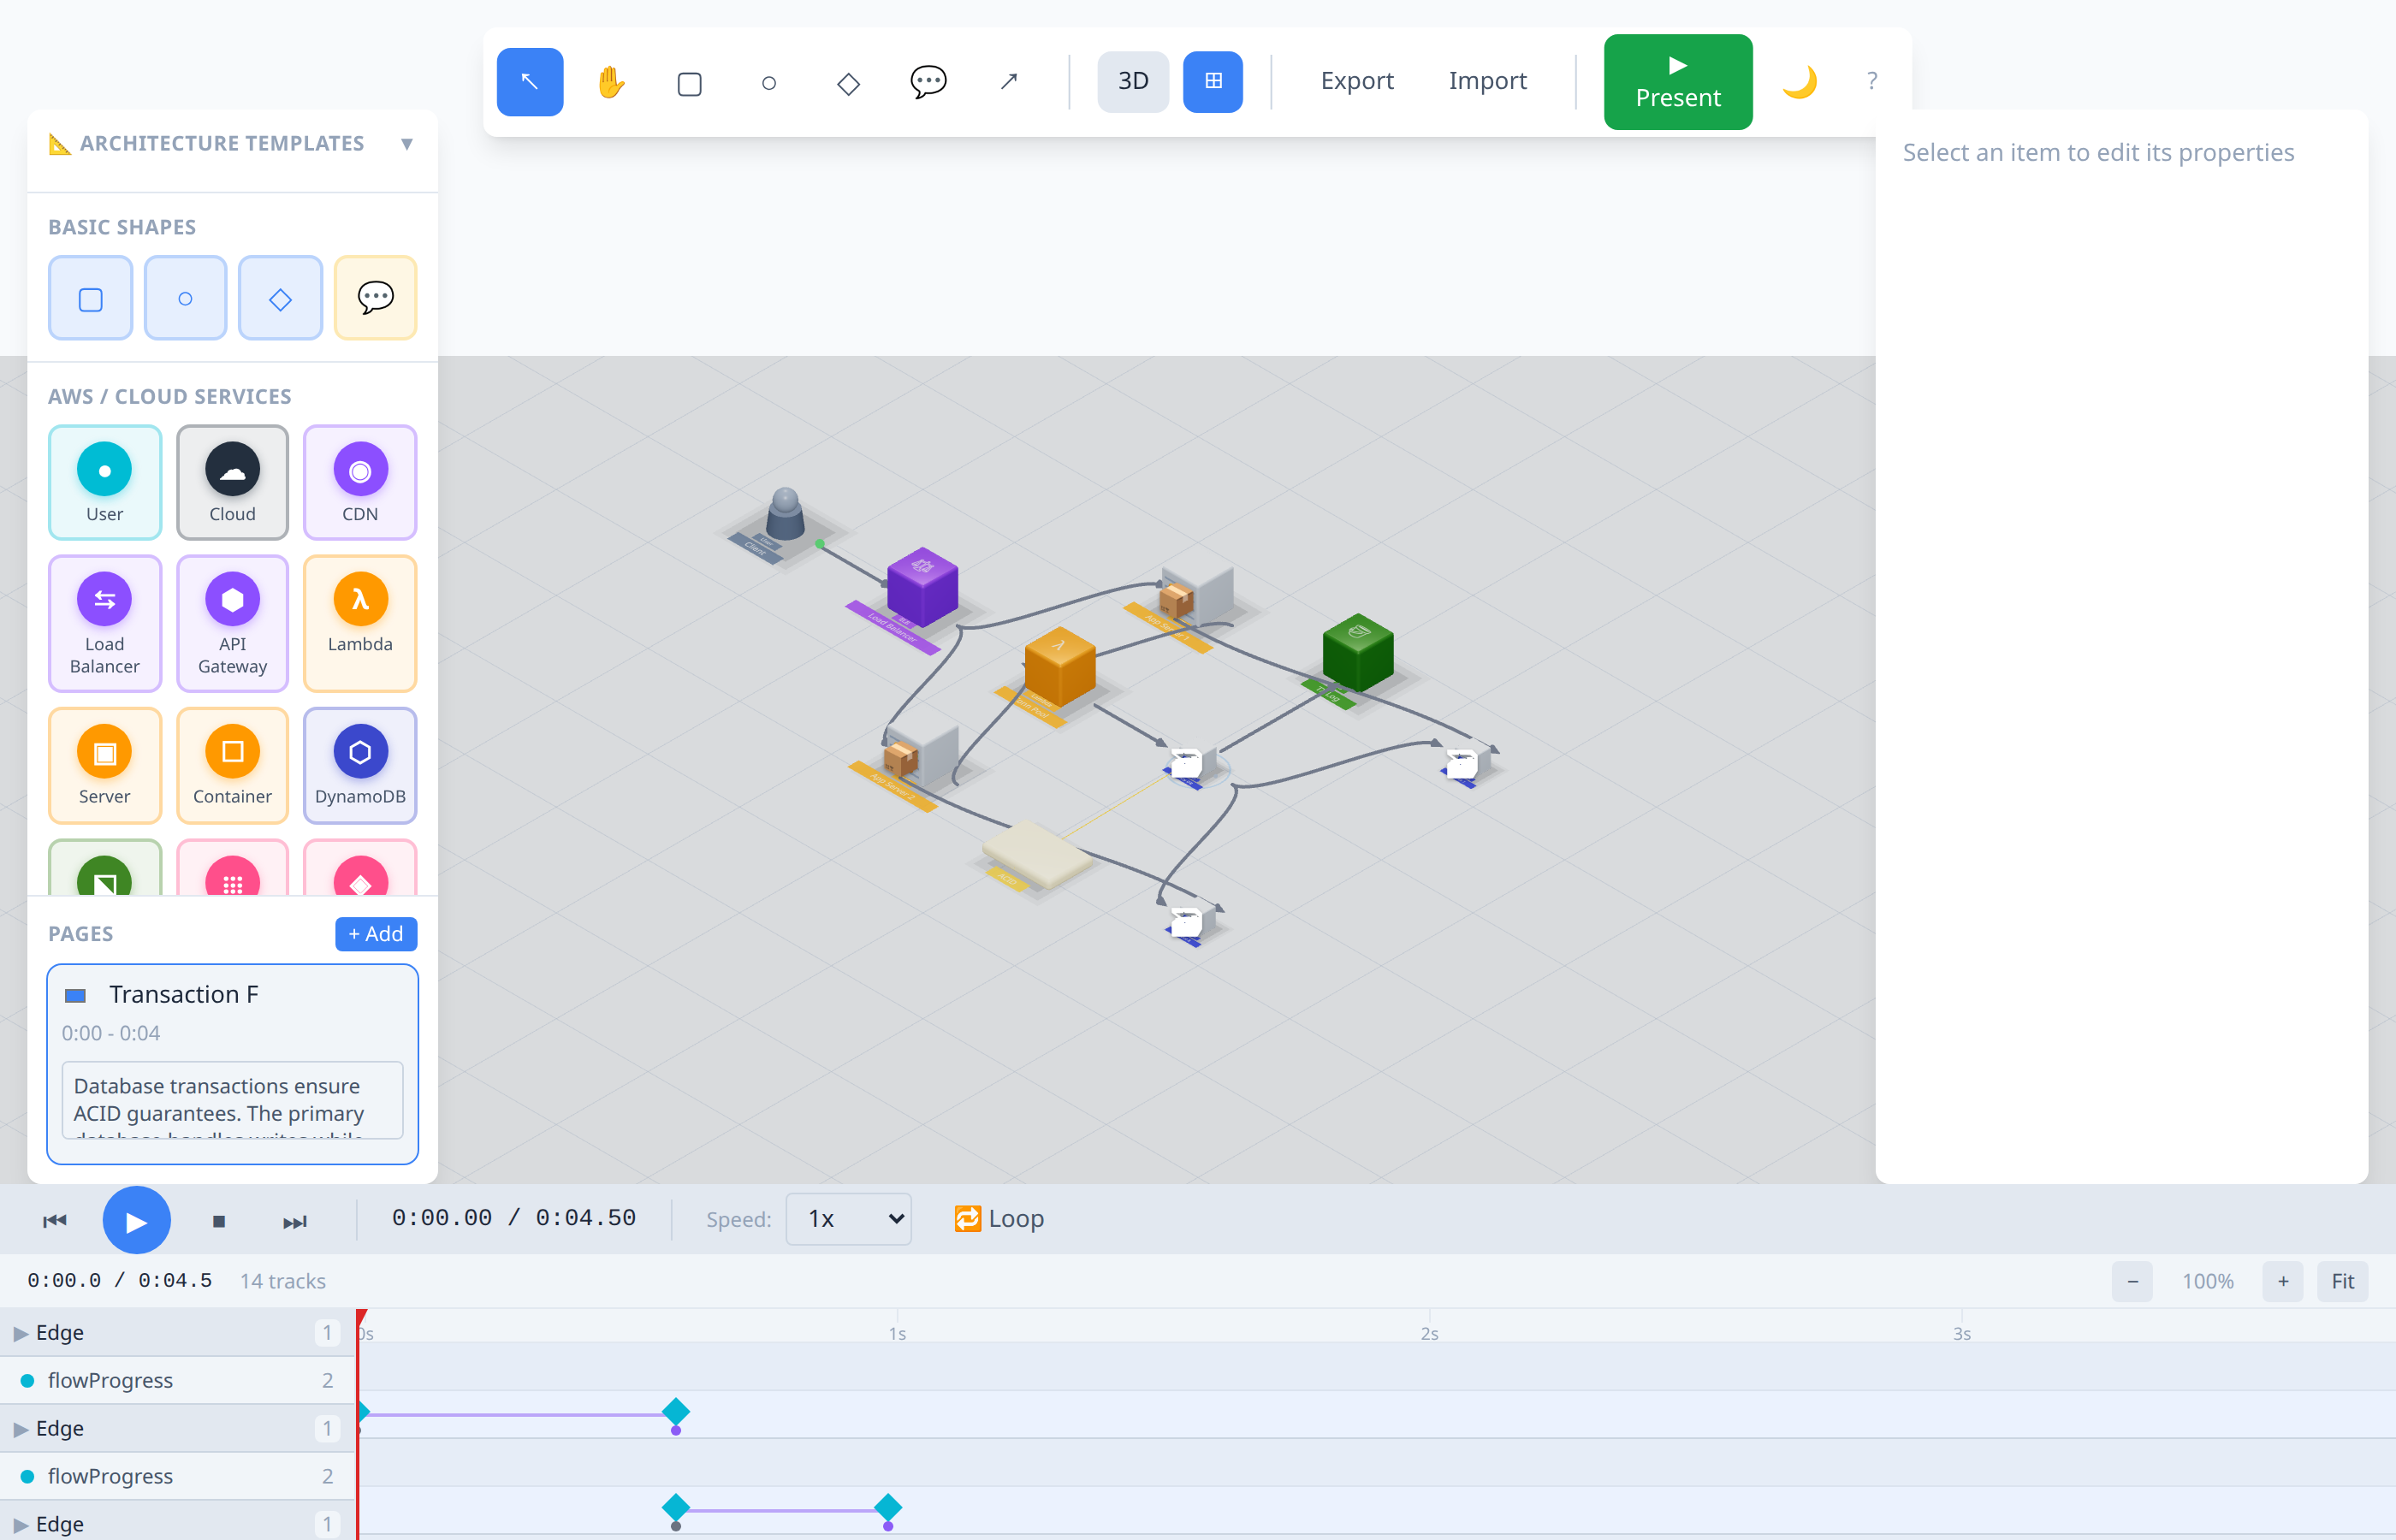
Kubernetes Cluster (3D):
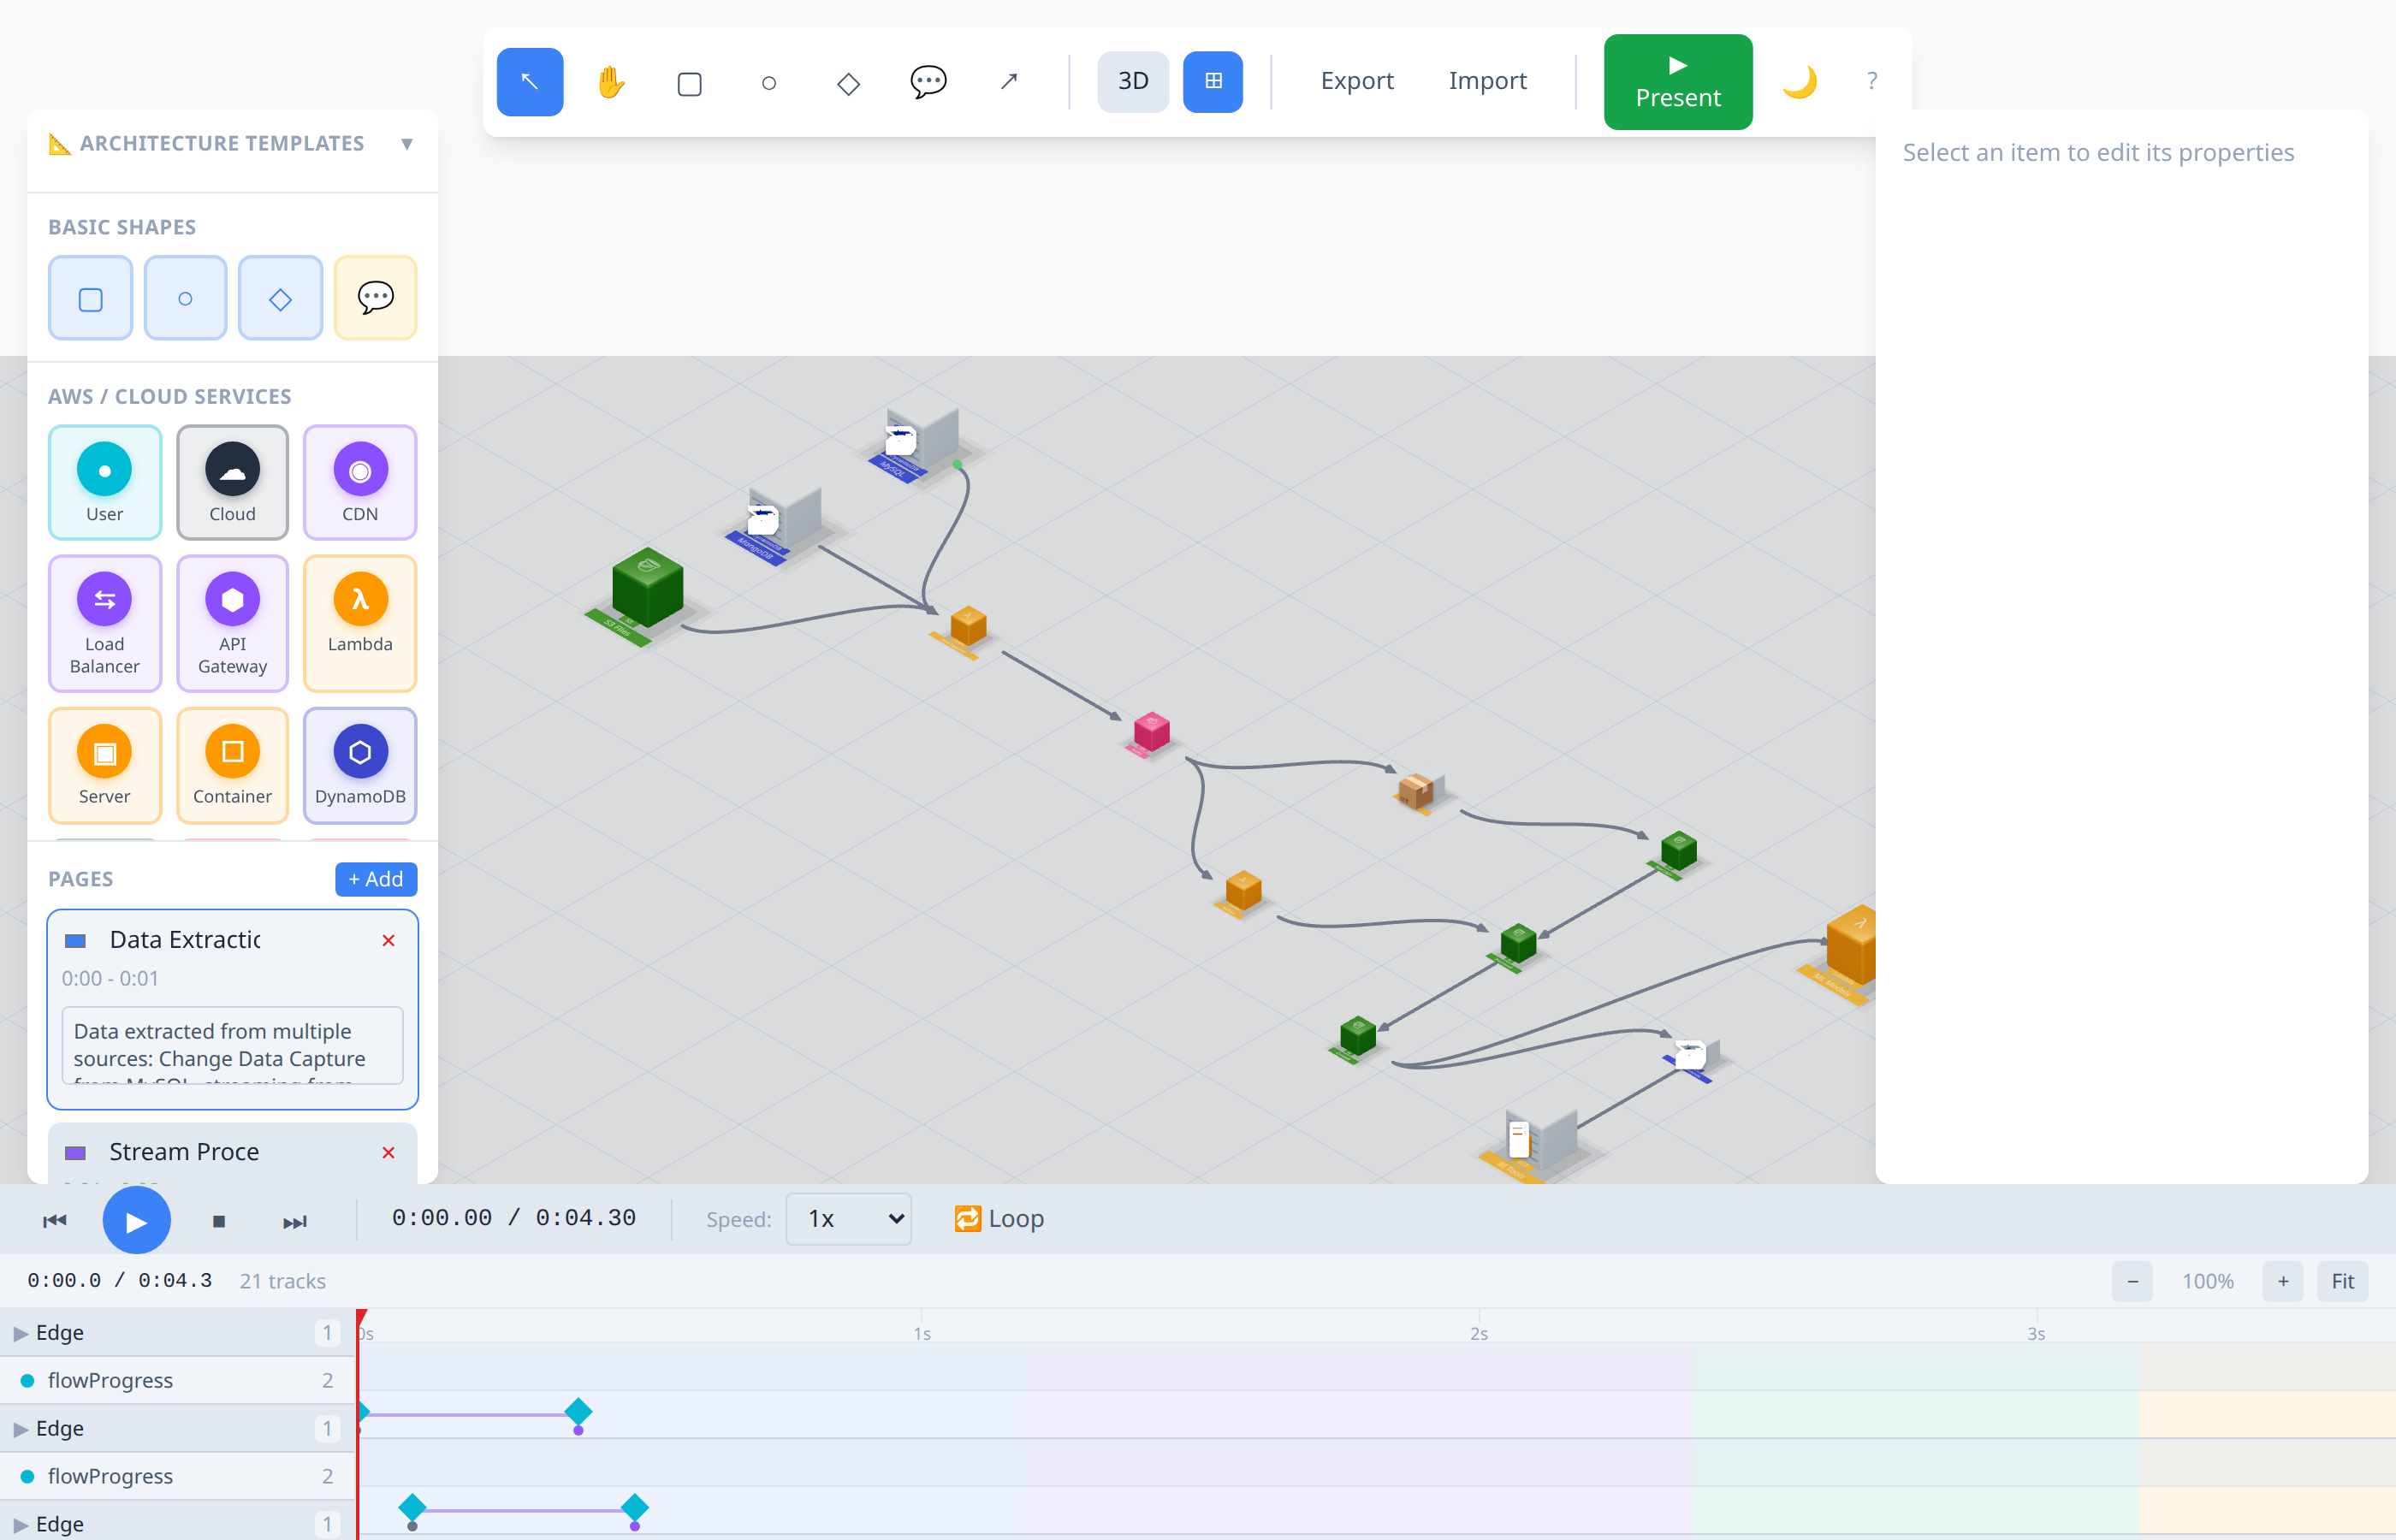
Data Pipeline (3D):
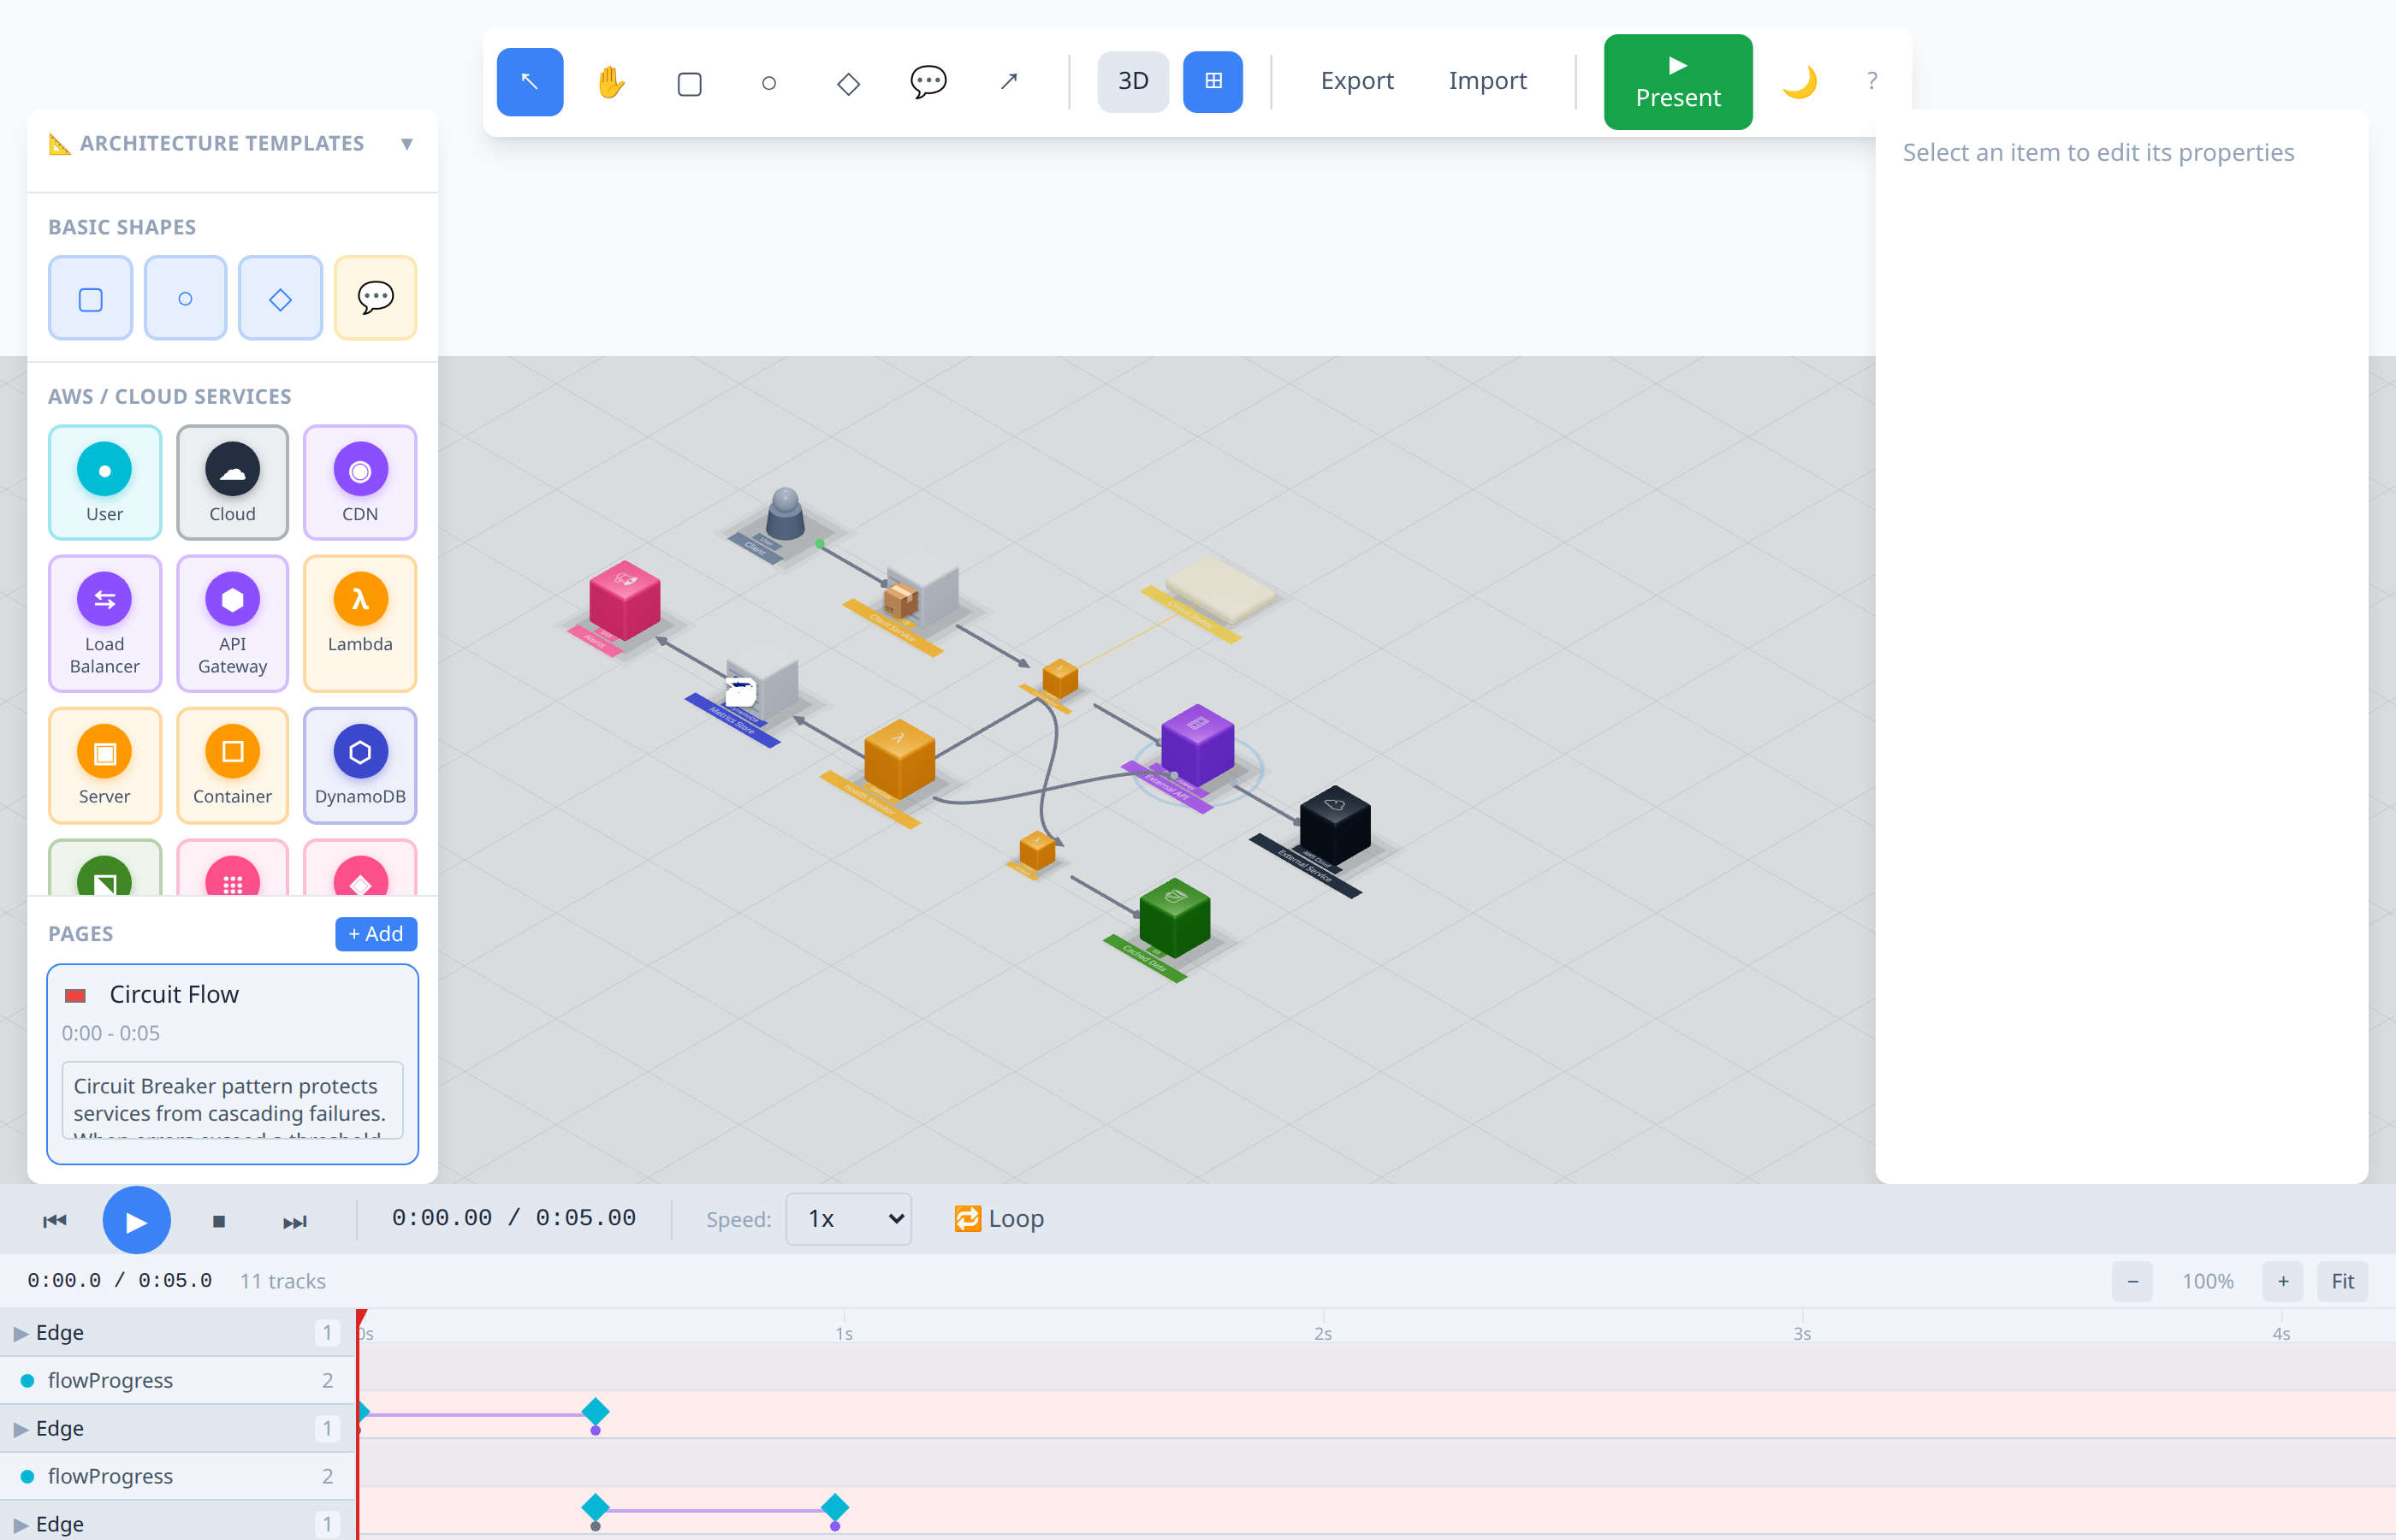
Circuit Breaker (3D):
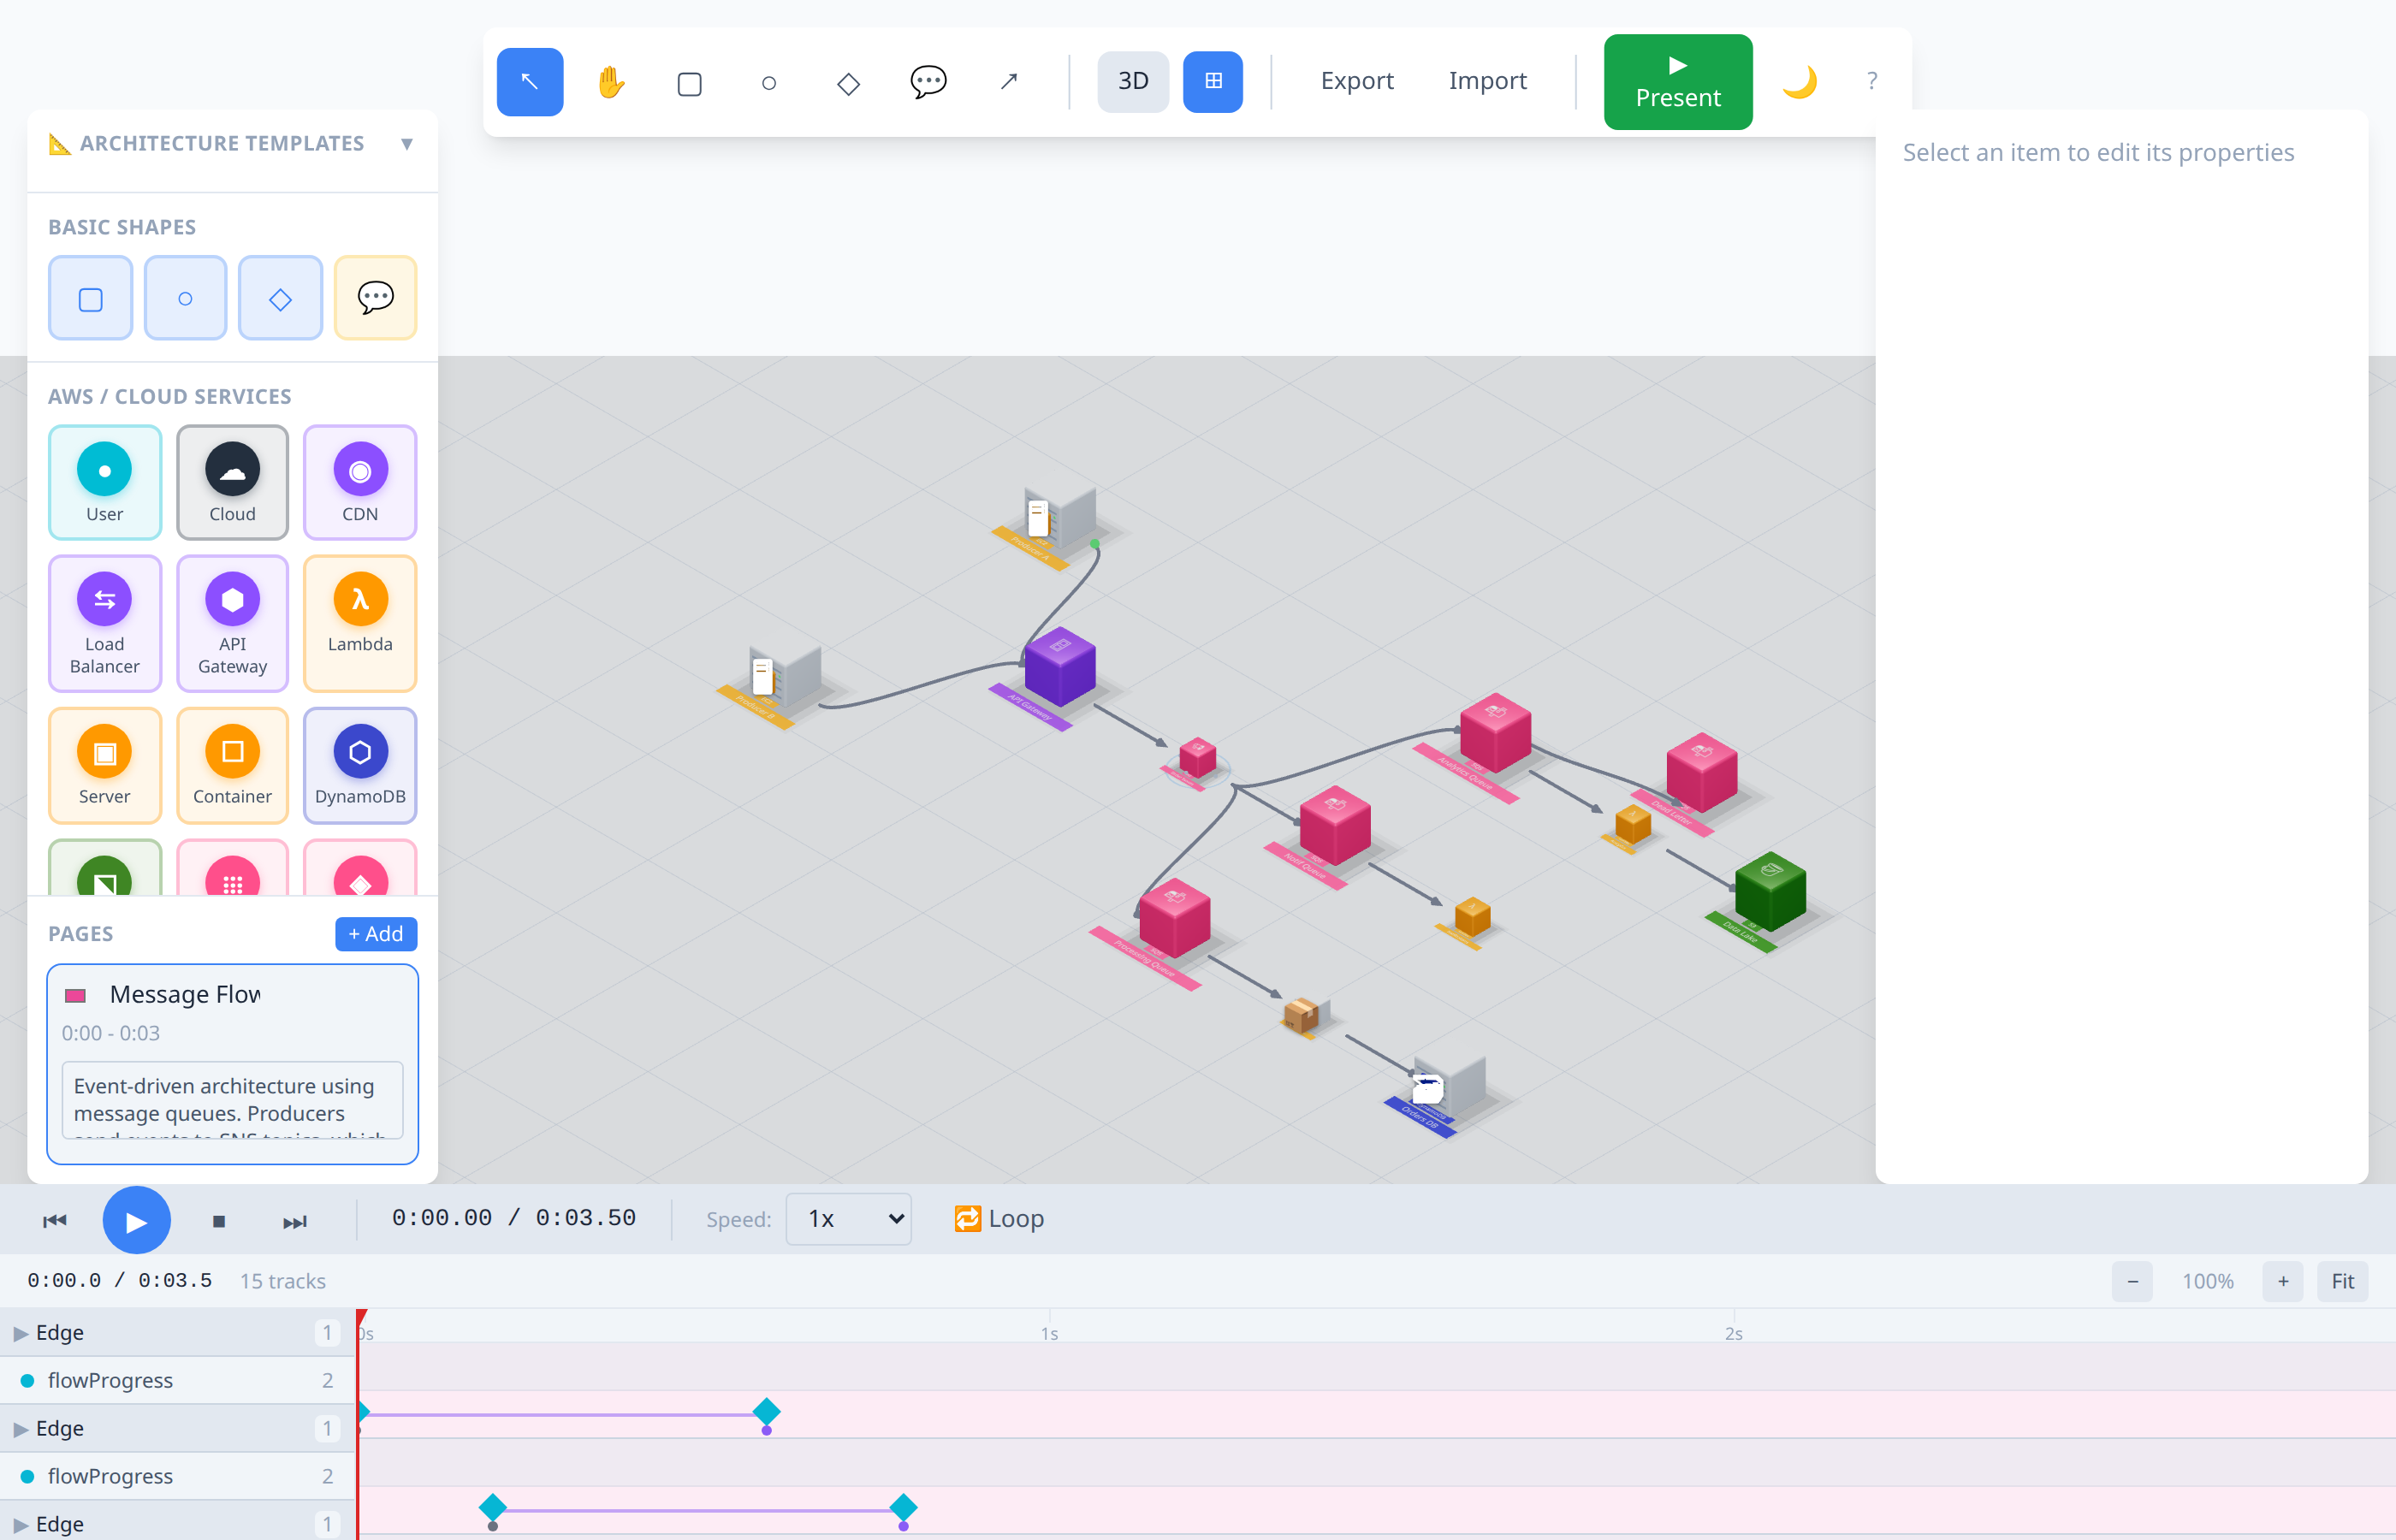
Message Queue (3D):
Database Transactions (3D):
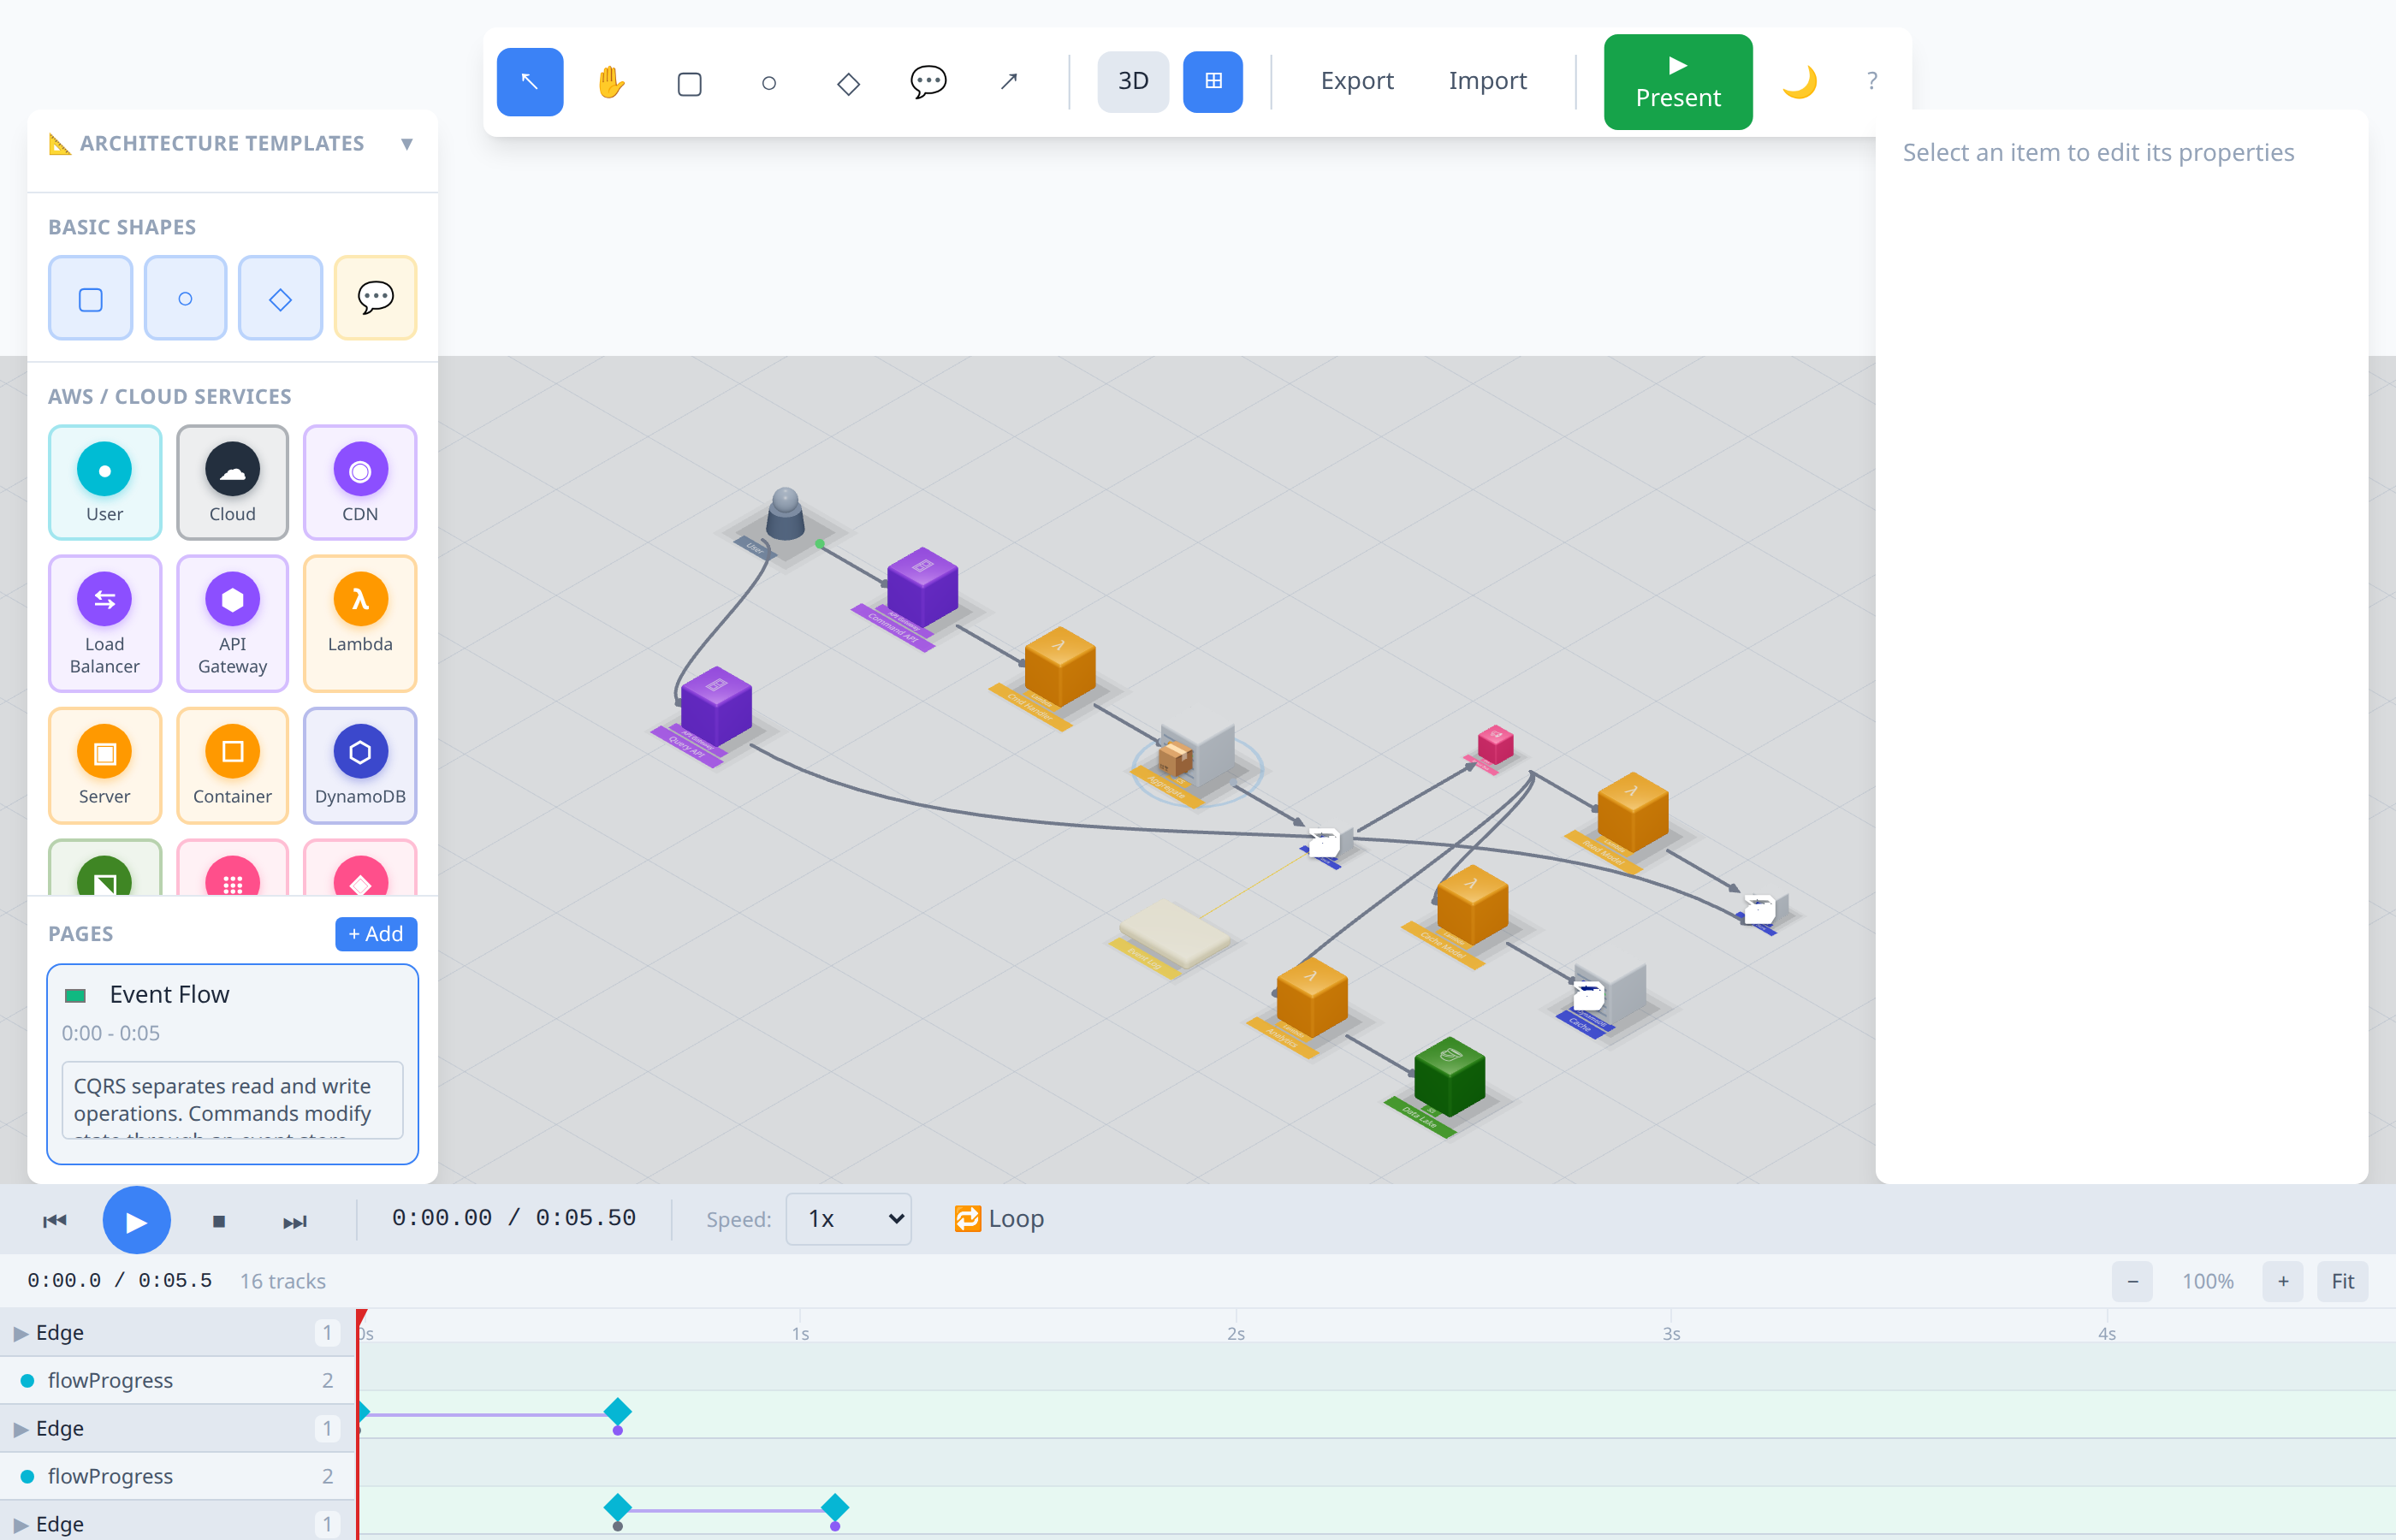
Event Sourcing (3D):
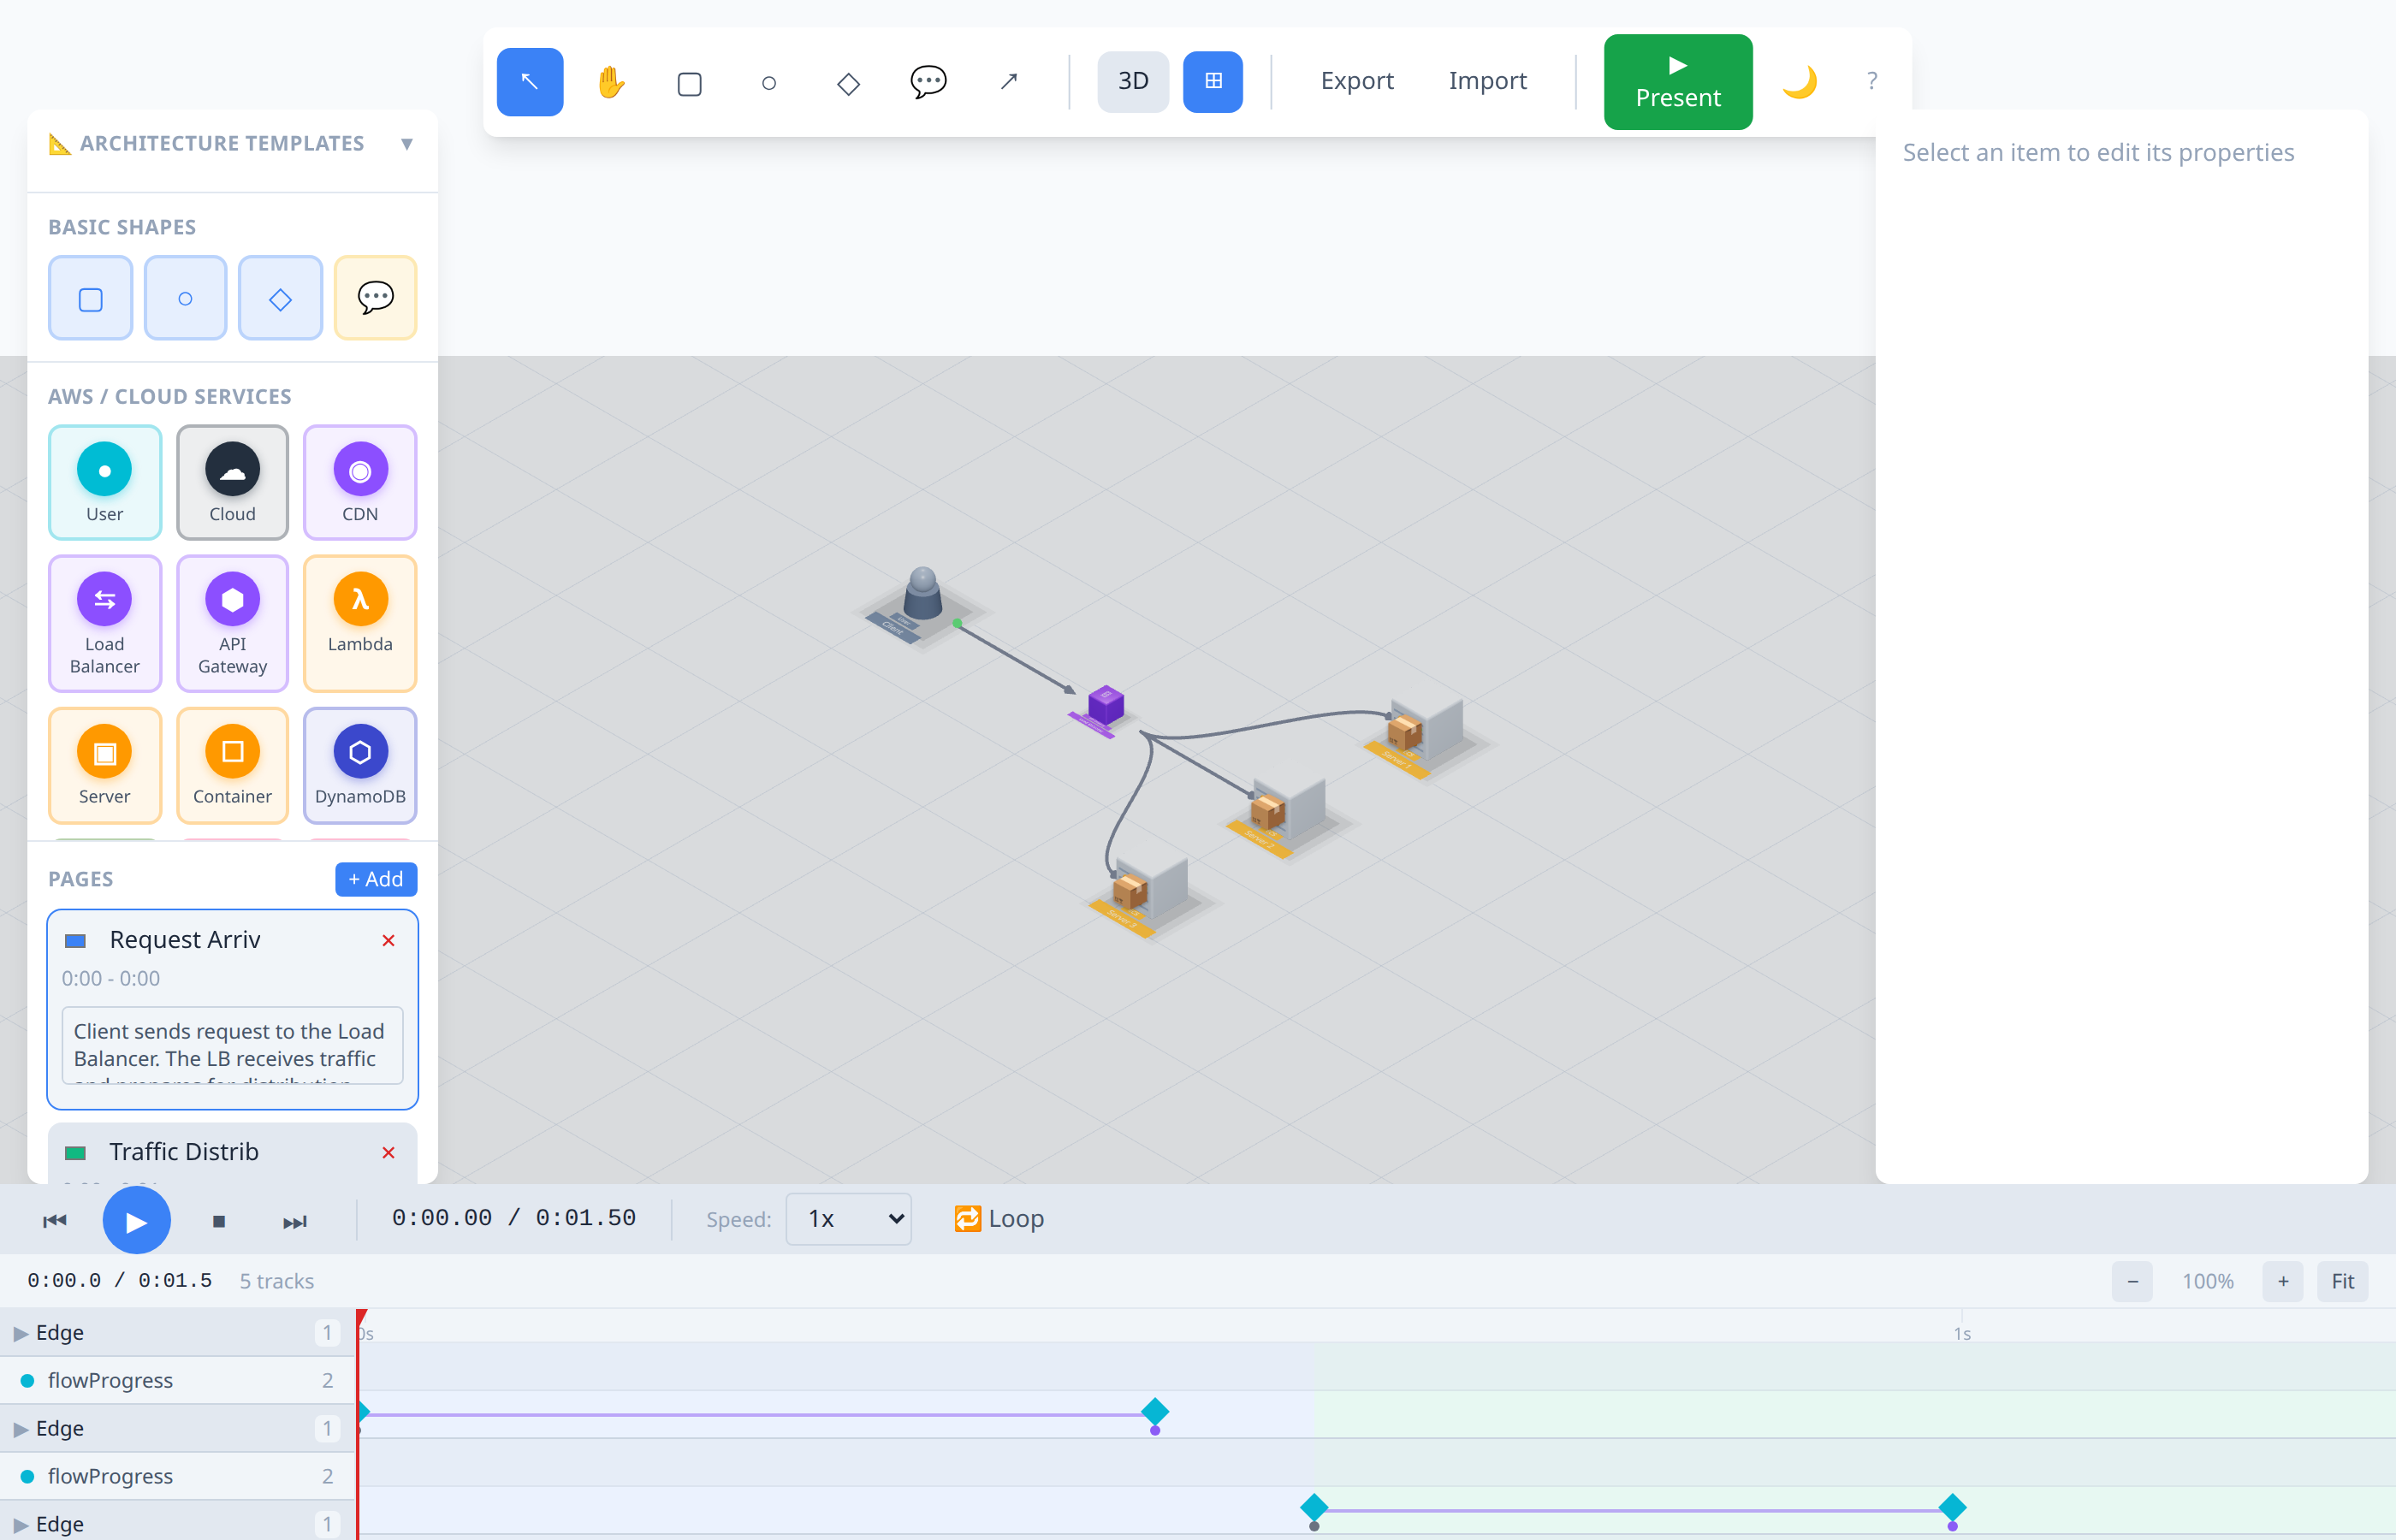
Load Balancer (3D):
Animation System
Animation Presets
Open the Animation Templates modal with Ctrl+Shift+A (or Cmd+Shift+A on Mac).
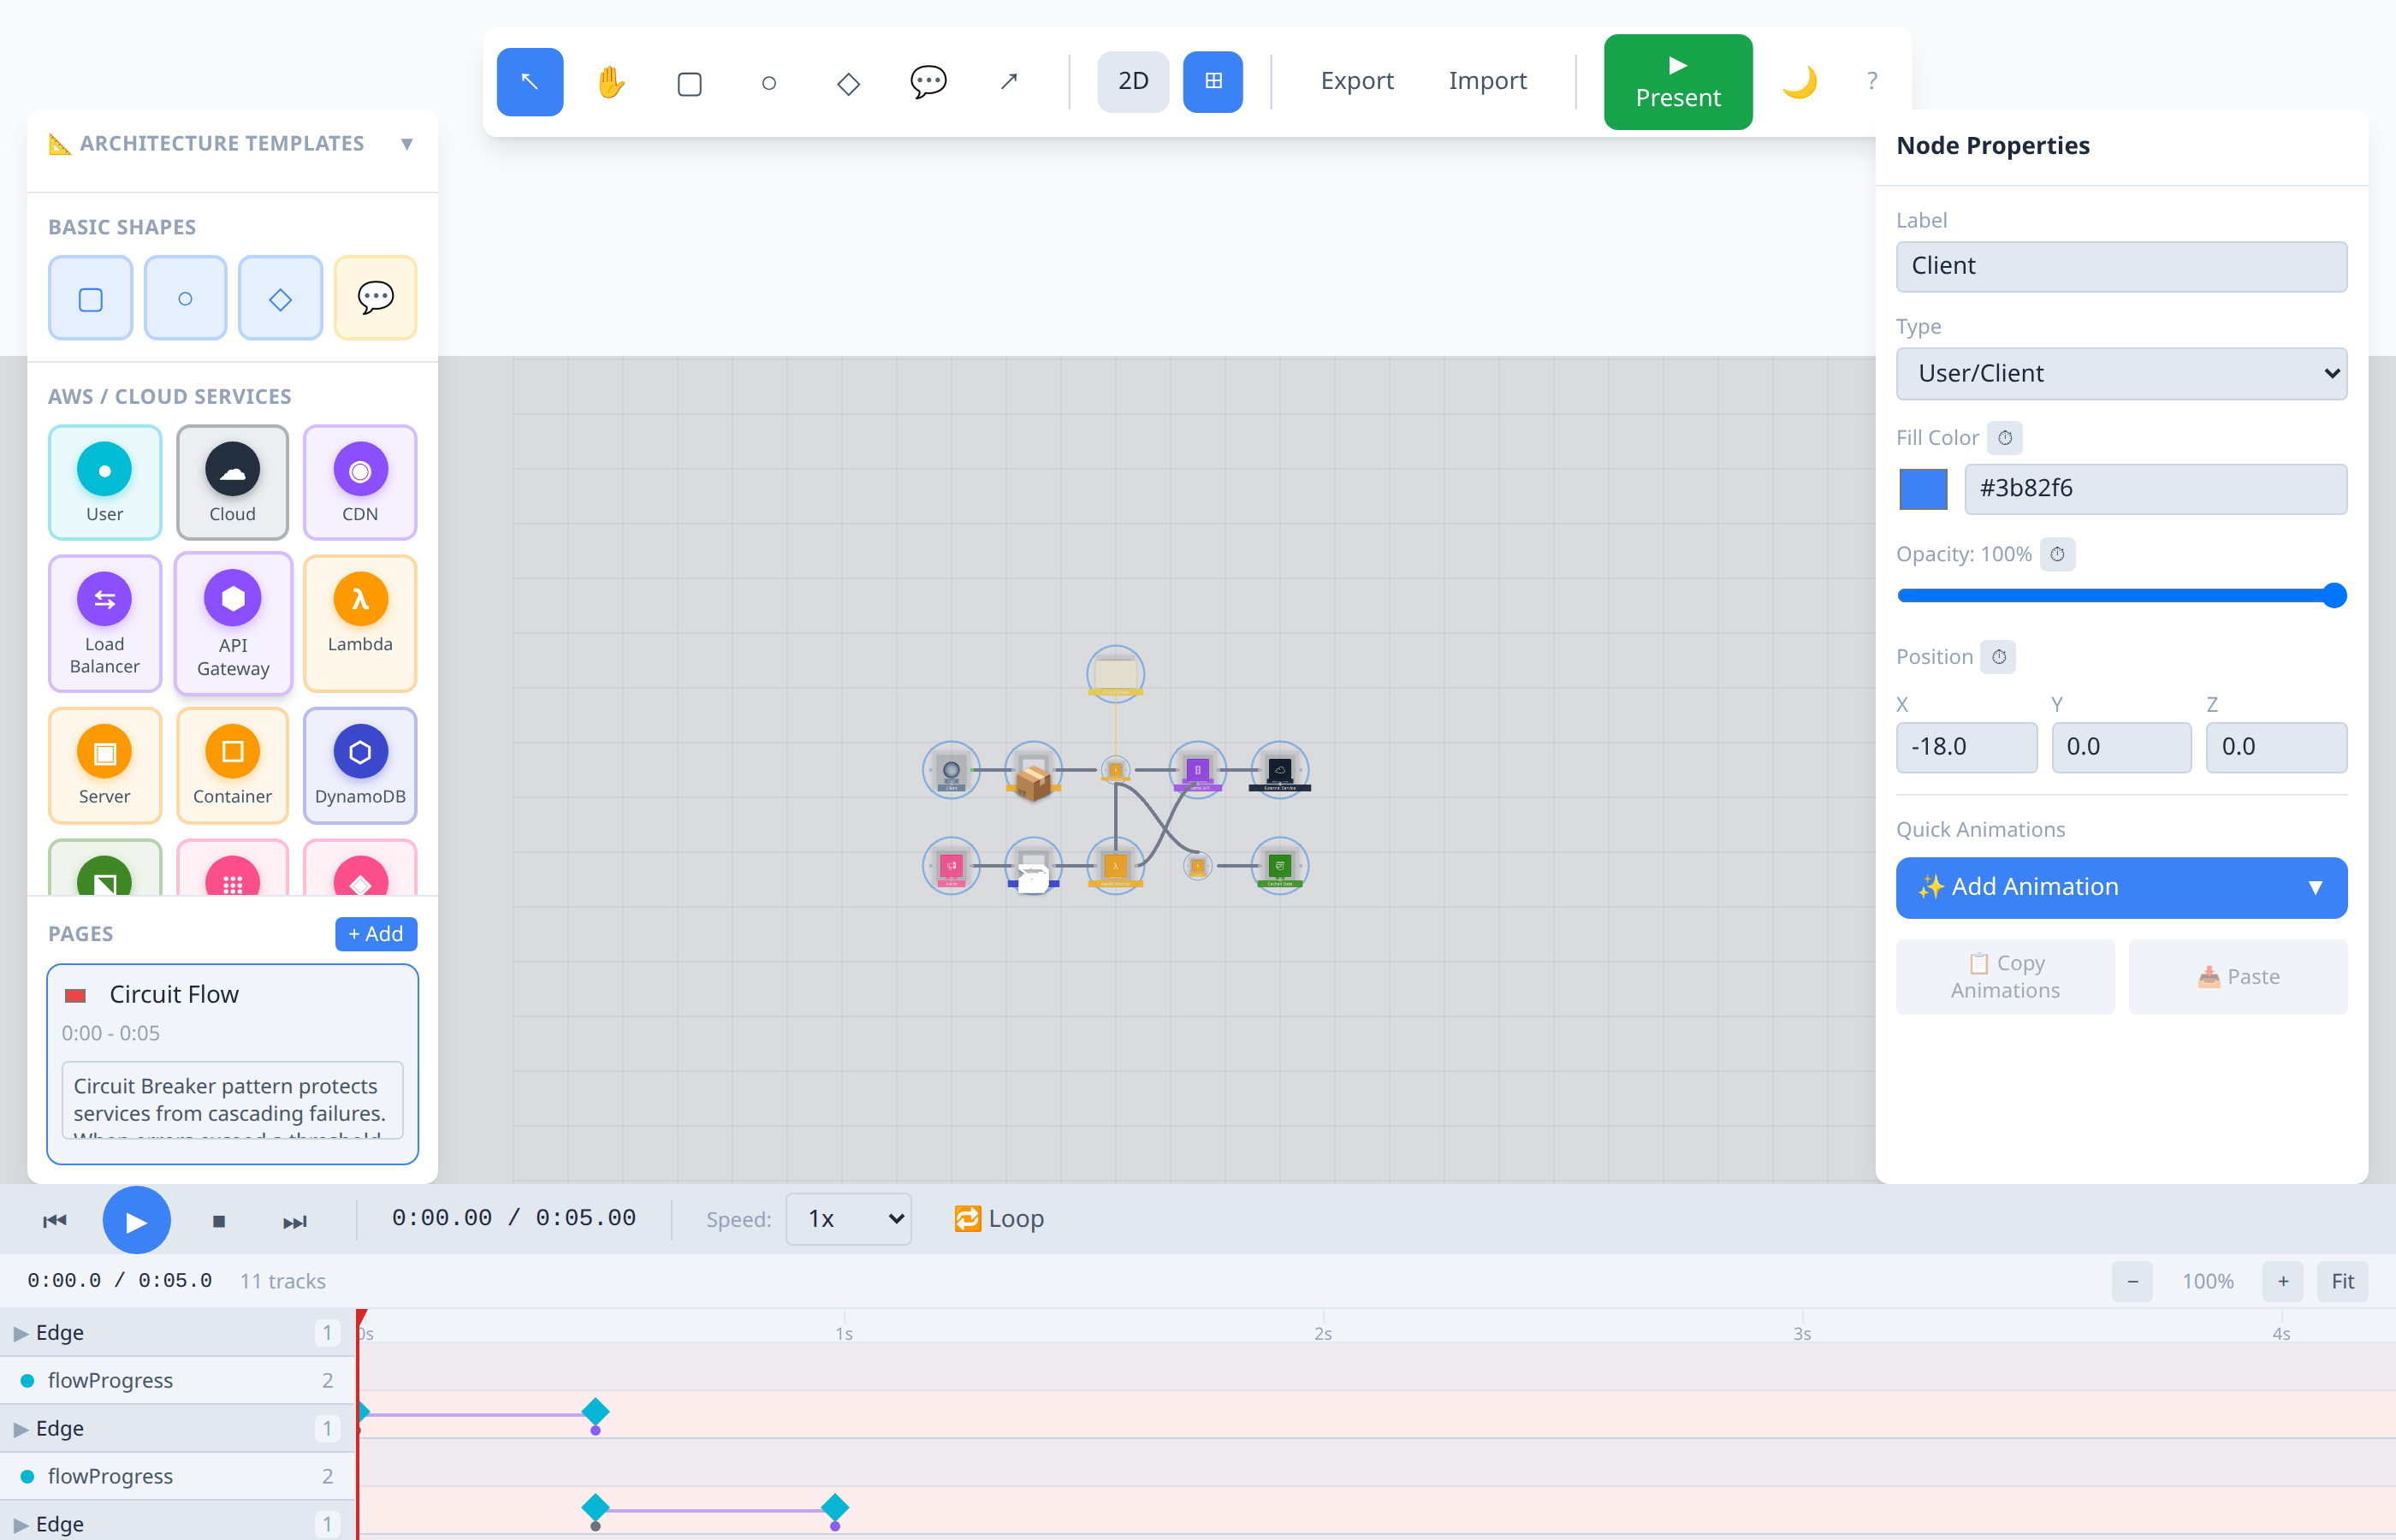
Presets are organized by category:
#### Entrance Animations
| Preset | Description |
|---|---|
| Fade In | Gradually appear from transparent |
| Scale In | Grow from zero to full size |
| Slide In | Slide in from the left |
| Drop In | Fall in from above |
| Pop In | Bounce in with elastic effect |
| Preset | Description |
|---|---|
| Pulse | Scale up and back rhythmically |
| Shake | Rapid horizontal vibration |
| Glow | Opacity pulsing effect |
| Preset | Description |
|---|---|
| Fade Out | Gradually disappear |
| Scale Out | Shrink to zero |
| Preset | Description |
|---|---|
| Flow Progress | Animate data flowing along an edge |
| Flow Pulse | Repeated flow animation |
| Preset | Description |
|---|---|
| Cascade Reveal | Elements appear one after another |
| Simultaneous Reveal | All elements appear at once |
| Highlight Path | Sequential glow along a path |
Applying Animation Presets
Ctrl+Shift+A)Animatable Properties
| Property | Type | Description |
|---|---|---|
| Position | [x, y, z] | Move elements across the canvas |
| Opacity | 0-1 | Control transparency |
| Scale | number | Resize elements |
| Rotation | degrees | Rotate elements |
| Fill Color | hex color | Animate color changes |
| Flow Progress | 0-1 | Animate edge data flow |
Easing Functions
| Easing | Description |
|---|---|
| Linear | Constant speed |
| Ease In | Start slow, finish fast |
| Ease Out | Start fast, finish slow |
| Ease In-Out | Start slow, speed up, finish slow |
Timeline Editor
The timeline editor sits at the bottom of the screen and provides full control over animation timing.
Transport Controls
- Play/Pause (Space) - Start or stop playback
- Stop - Return to beginning
- Step Forward/Back - Move frame by frame
- Loop - Toggle continuous looping
- Speed - Adjust playback speed (0.25x to 4x)
Working with Keyframes
- Add keyframe: Right-click on a track at the desired time
- Move keyframe: Drag a keyframe diamond along the timeline
- Edit keyframe: Click a keyframe to edit its value and easing
- Delete keyframe: Right-click and select "Delete Keyframe"
- Select multiple: Ctrl+click to multi-select keyframes
Track Management
Each animation track appears as a row in the timeline:
- Tracks are color-coded by property type (blue=position, green=opacity, yellow=scale, pink=rotation, purple=fillColor, cyan=flowProgress)
- Expand/collapse tracks to see keyframe details
- Delete tracks from the right-click context menu
Zoom and Pan
- Scroll to zoom in/out on the timeline
- The time ruler shows seconds and frames
- Drag the playhead (red line) to scrub through time
Presentation Mode
Presentation mode turns your diagram into an interactive, step-by-step walkthrough. It works in both 2D and 3D views.
3D Presentation Examples
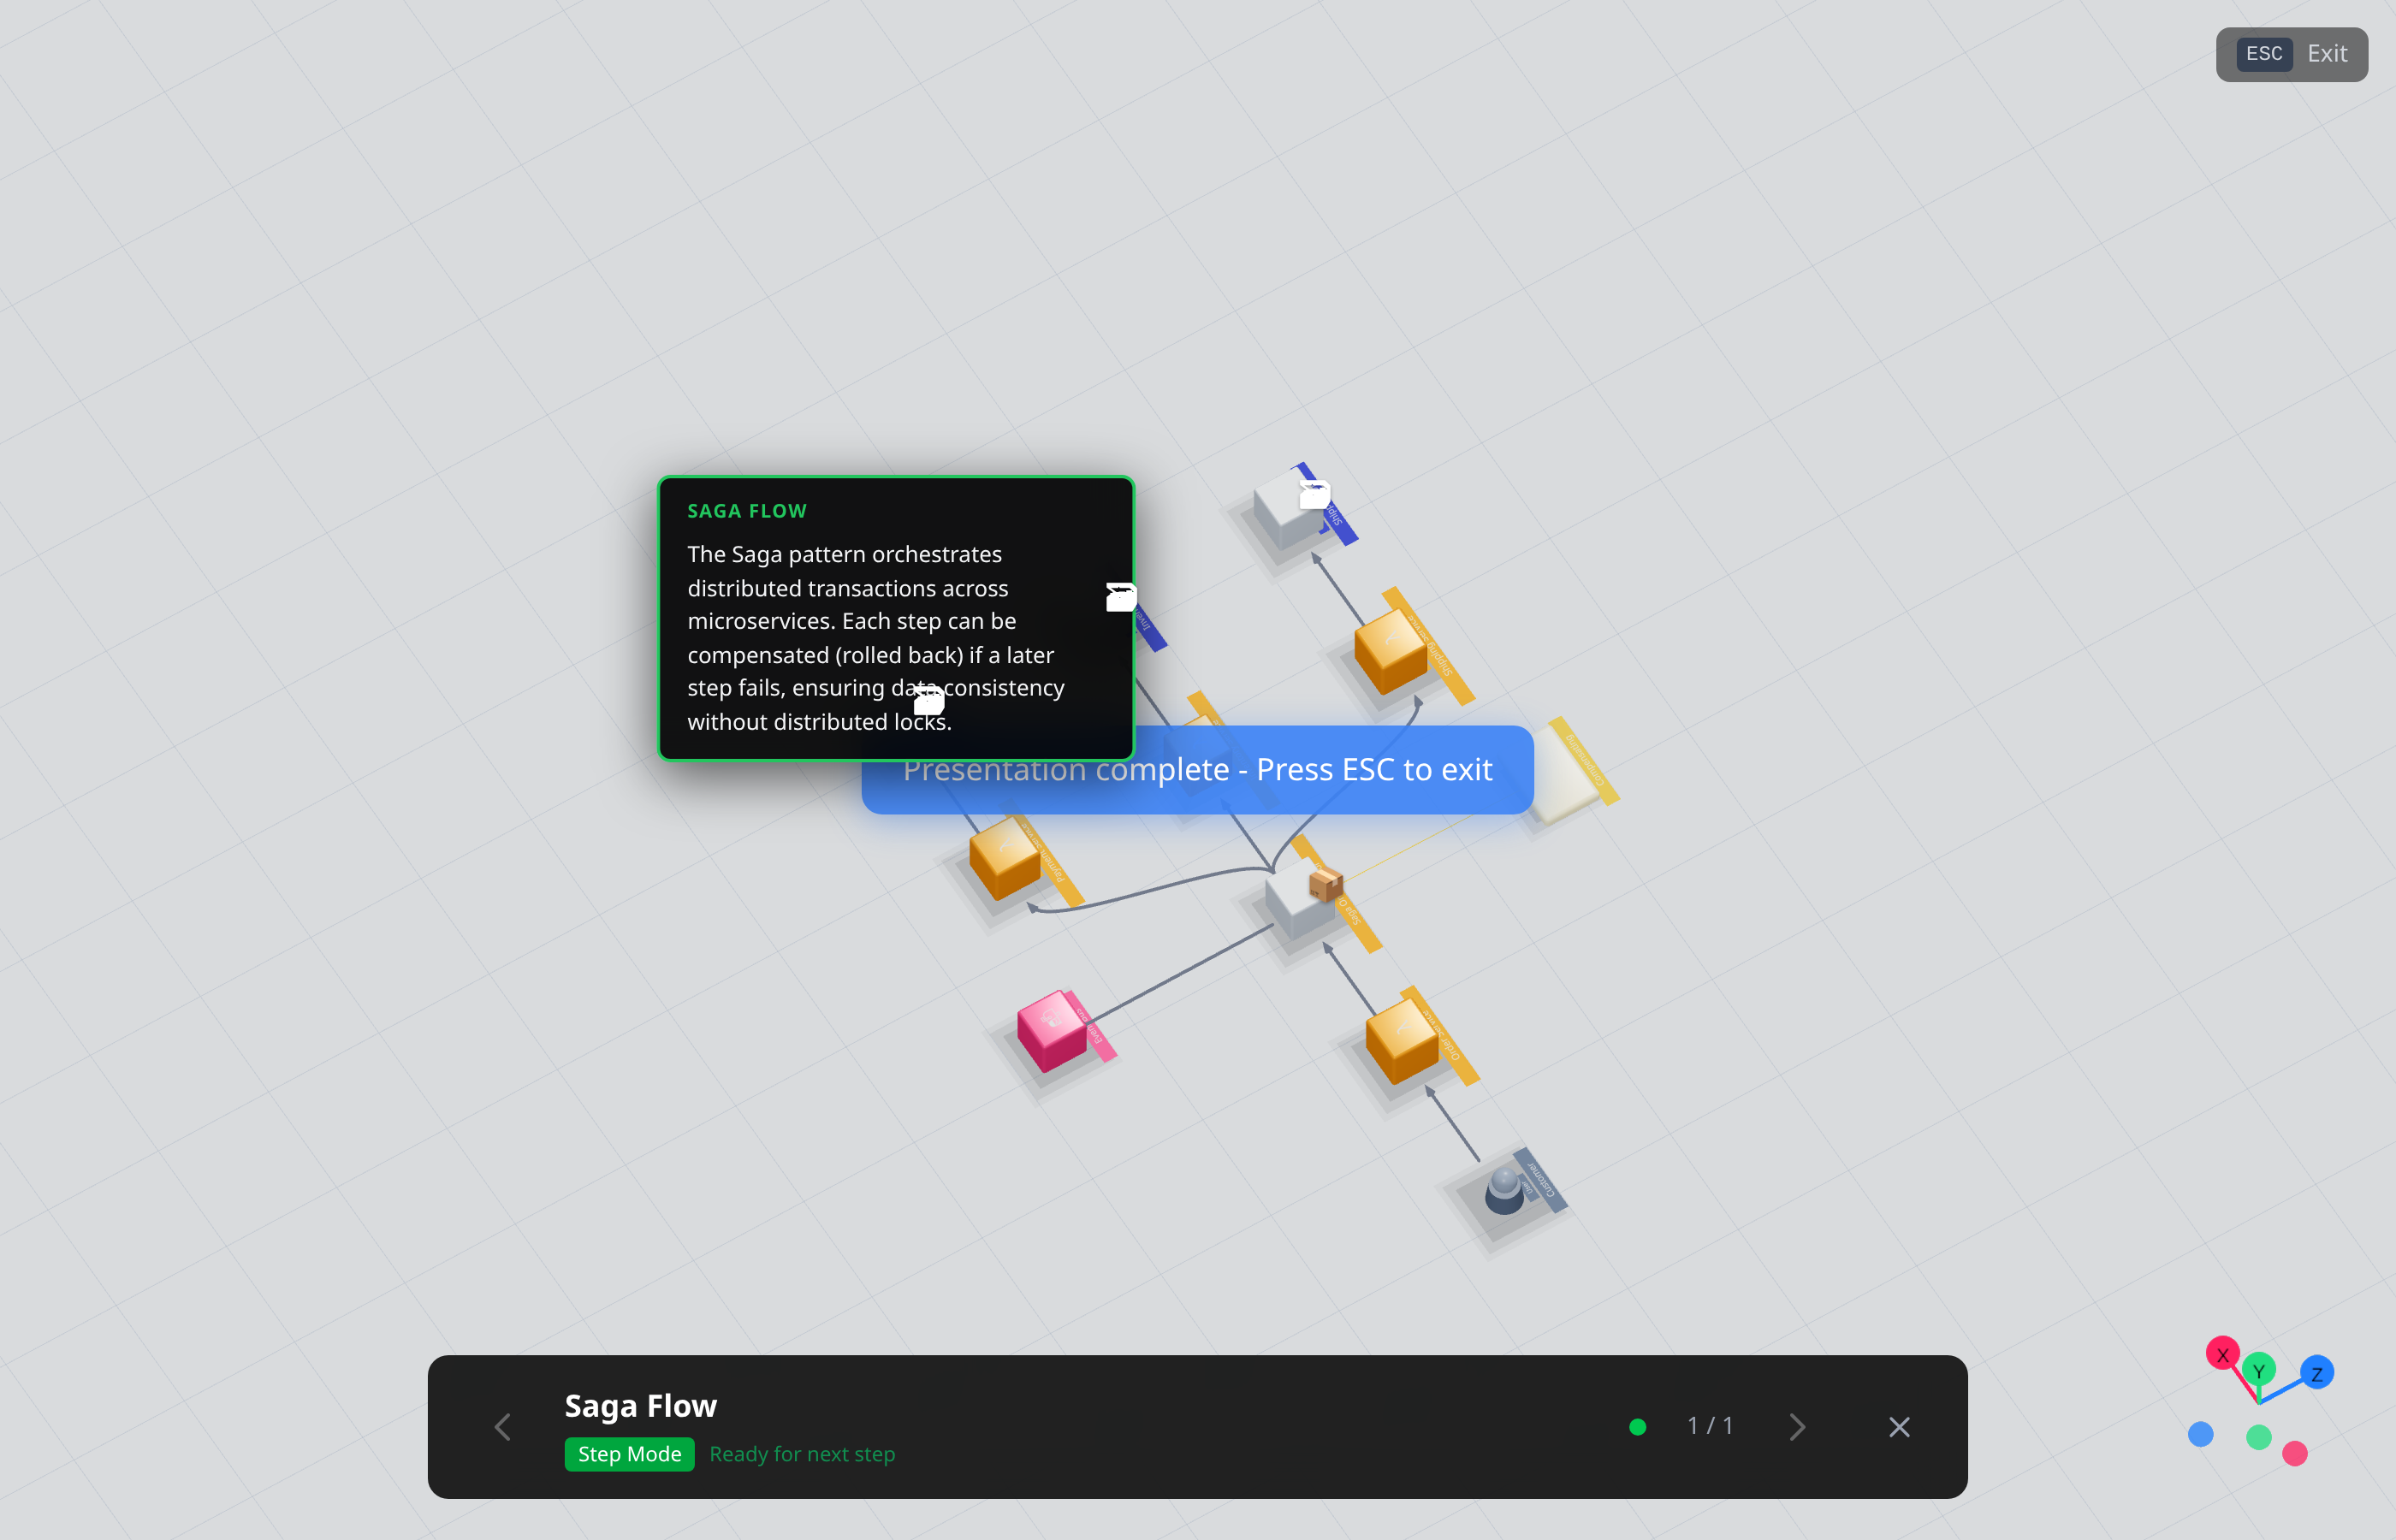
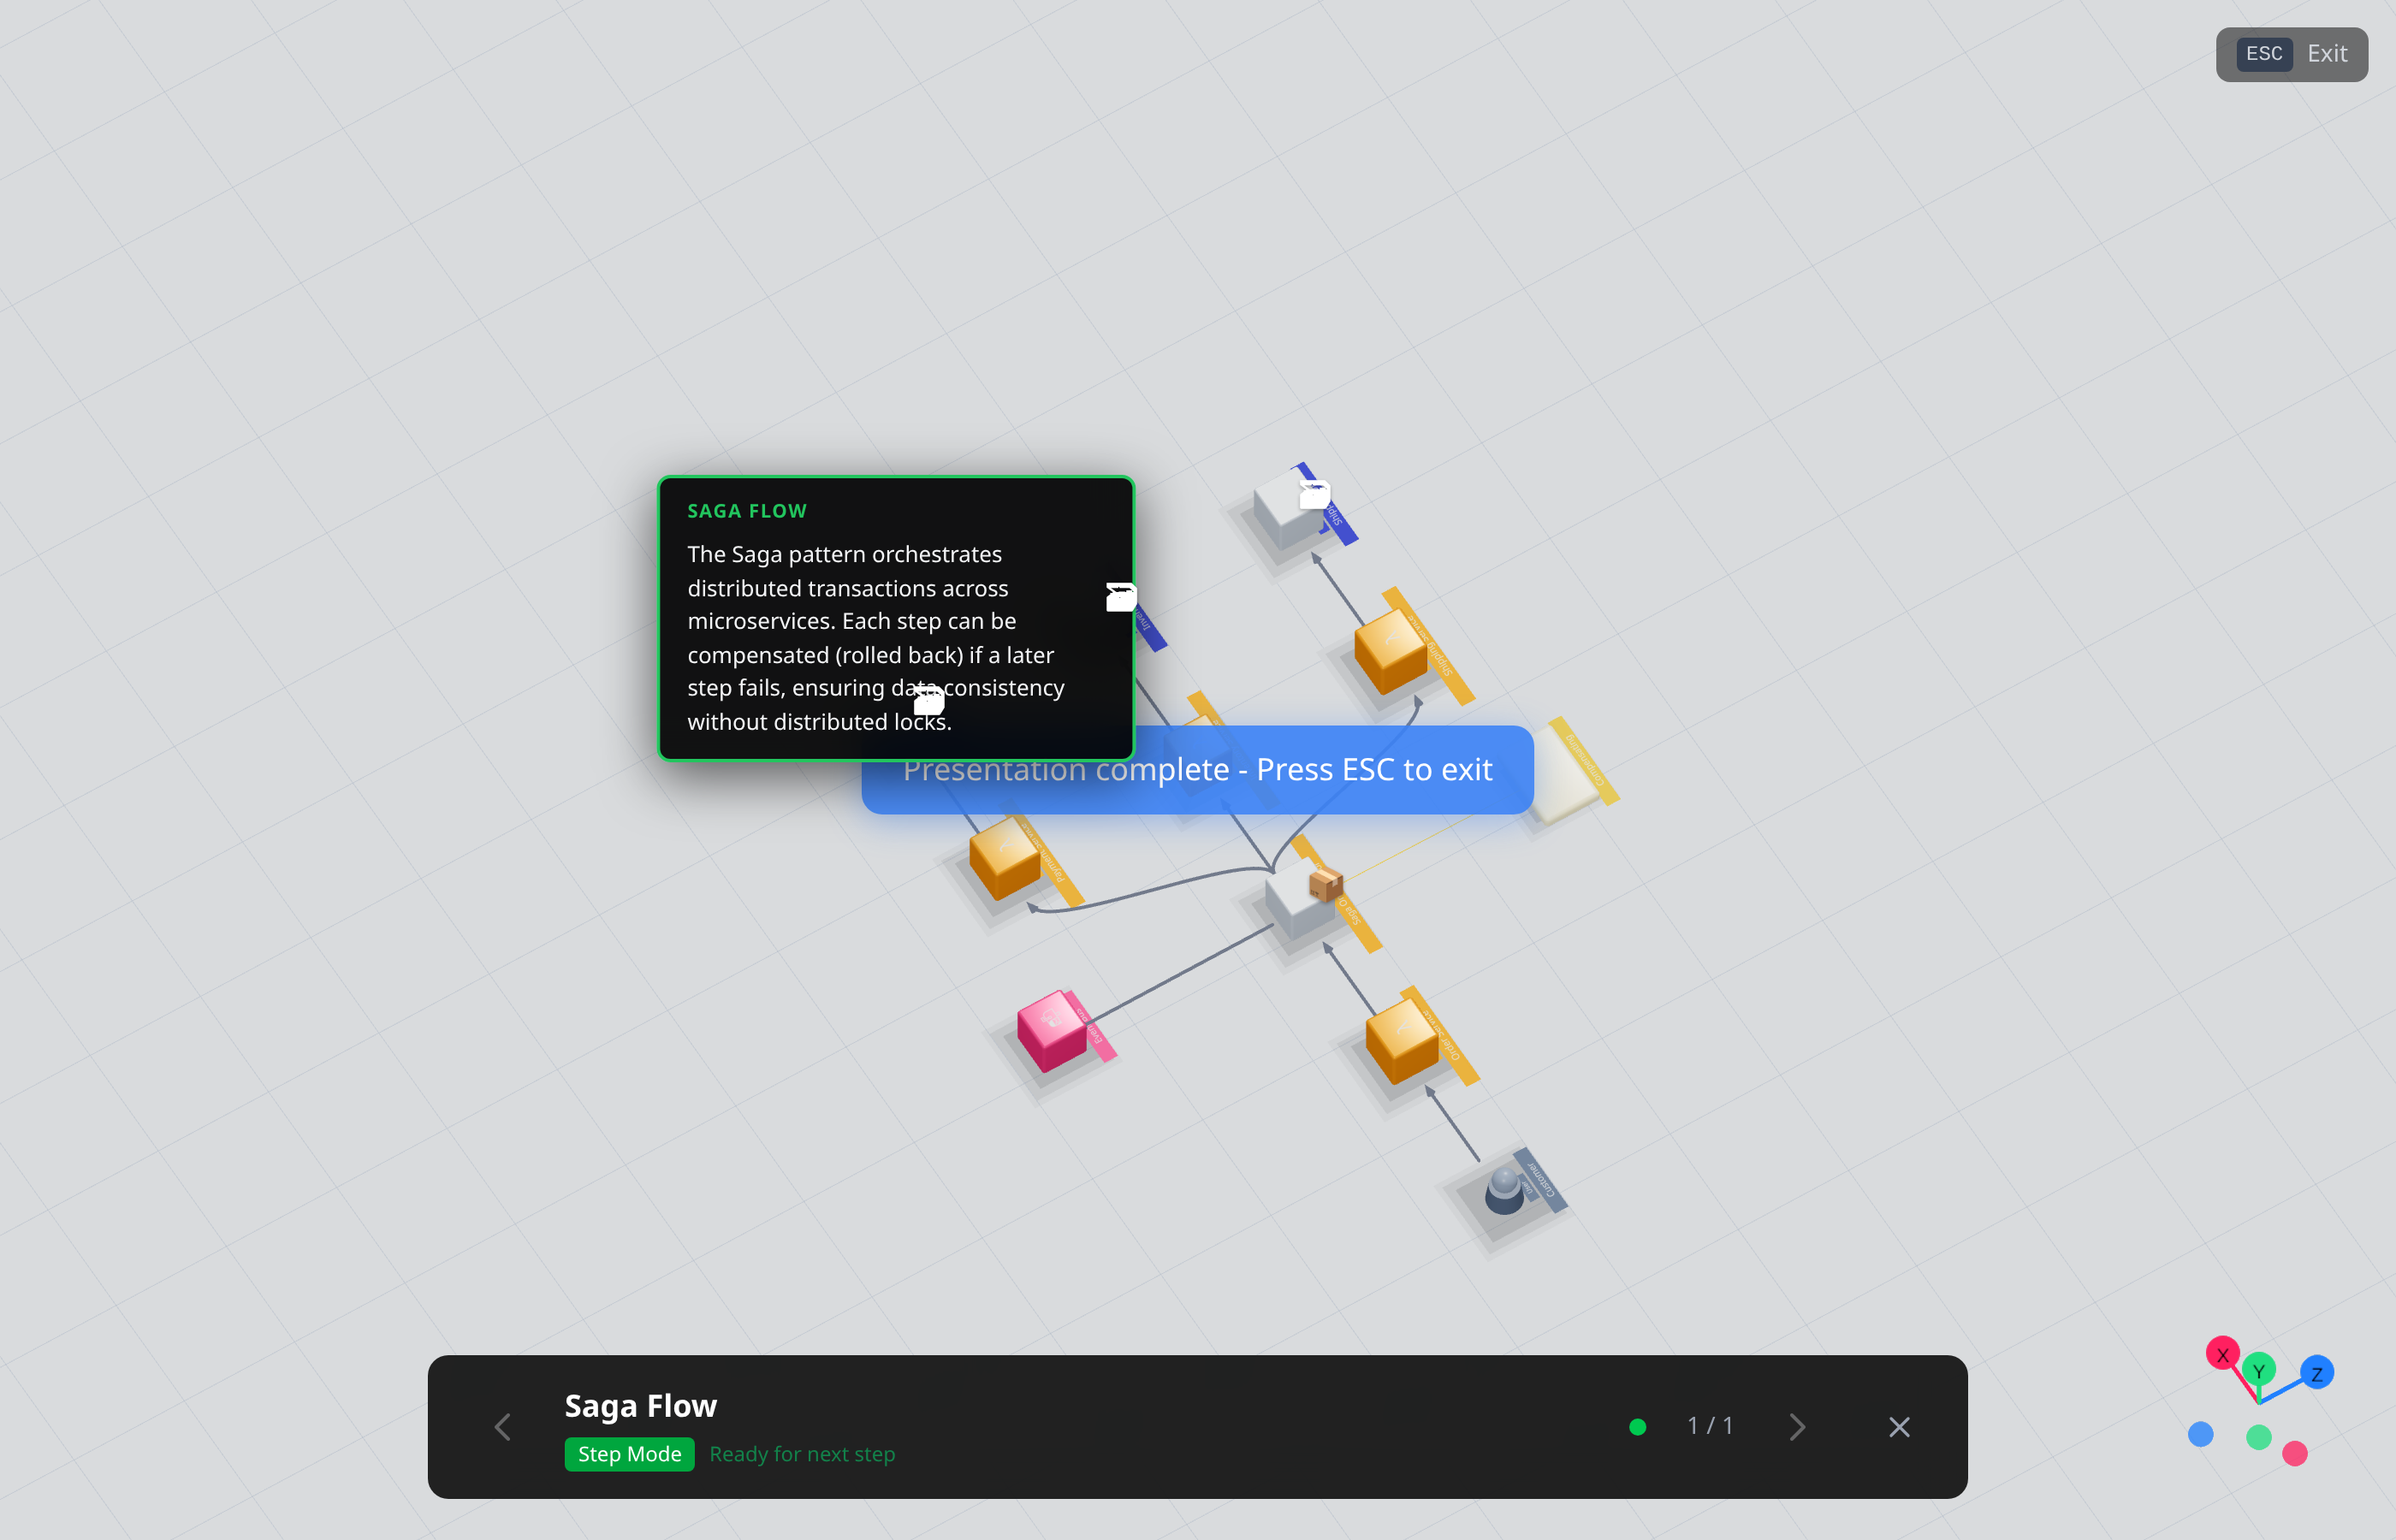
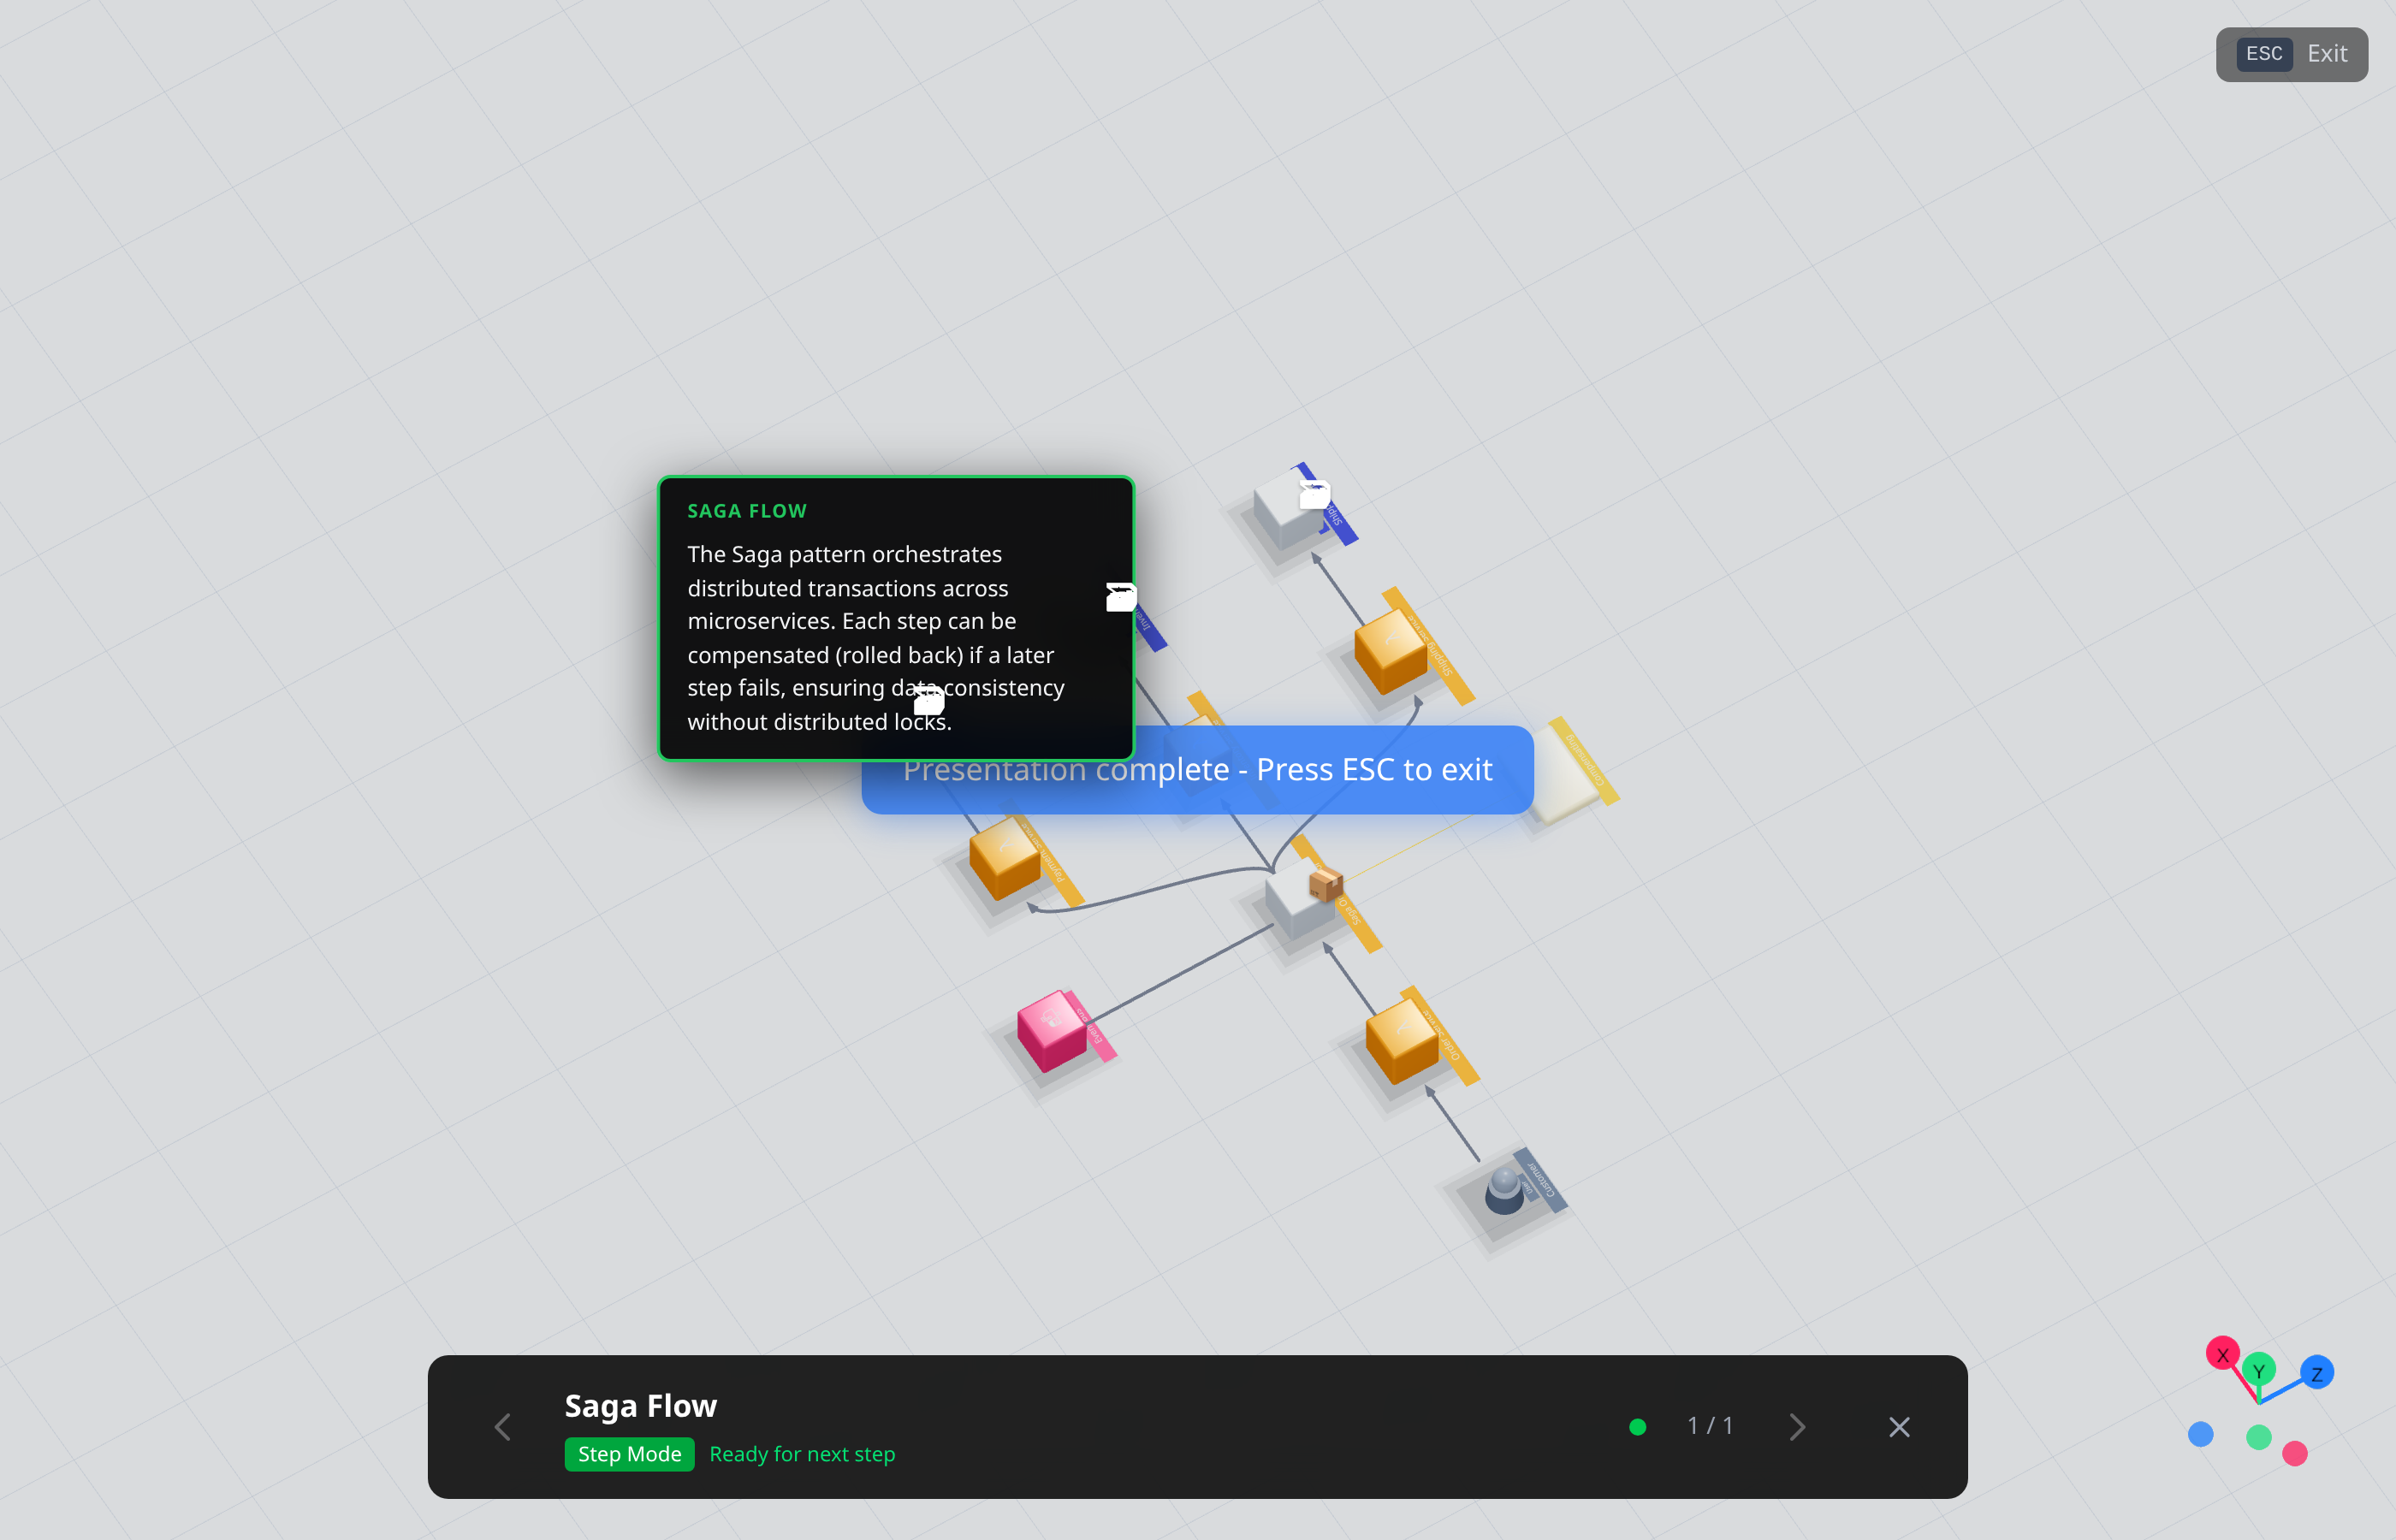
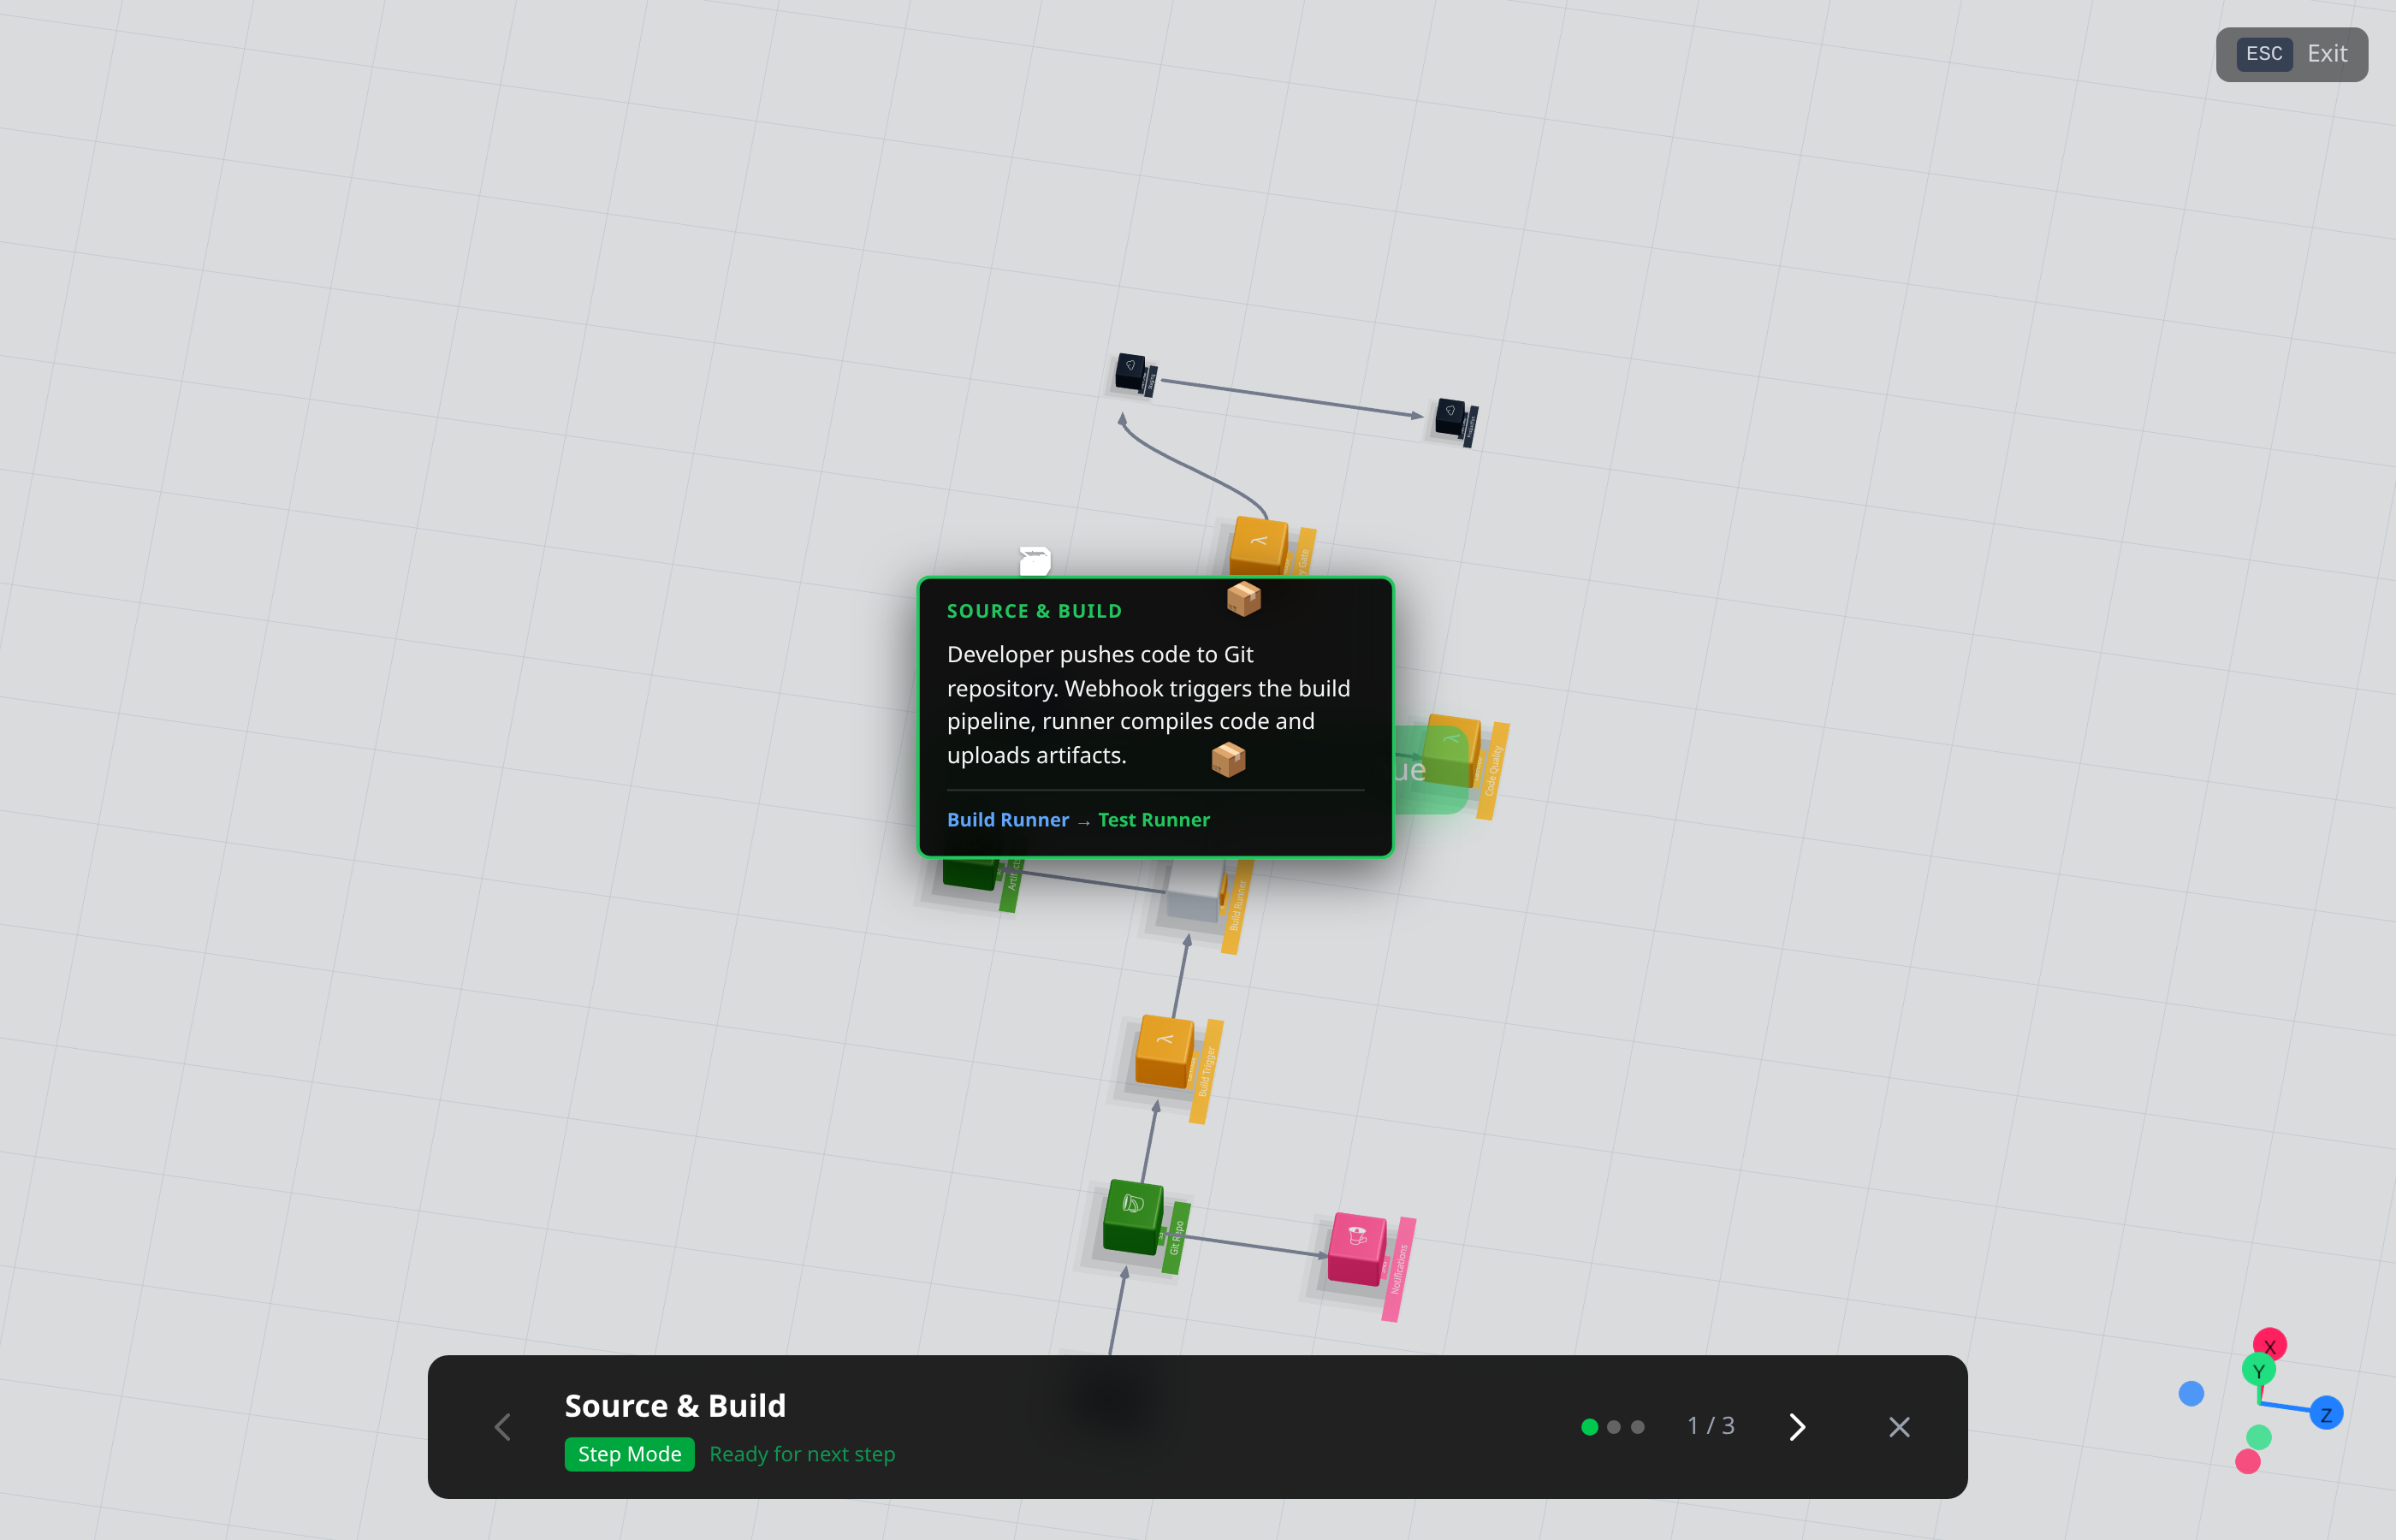
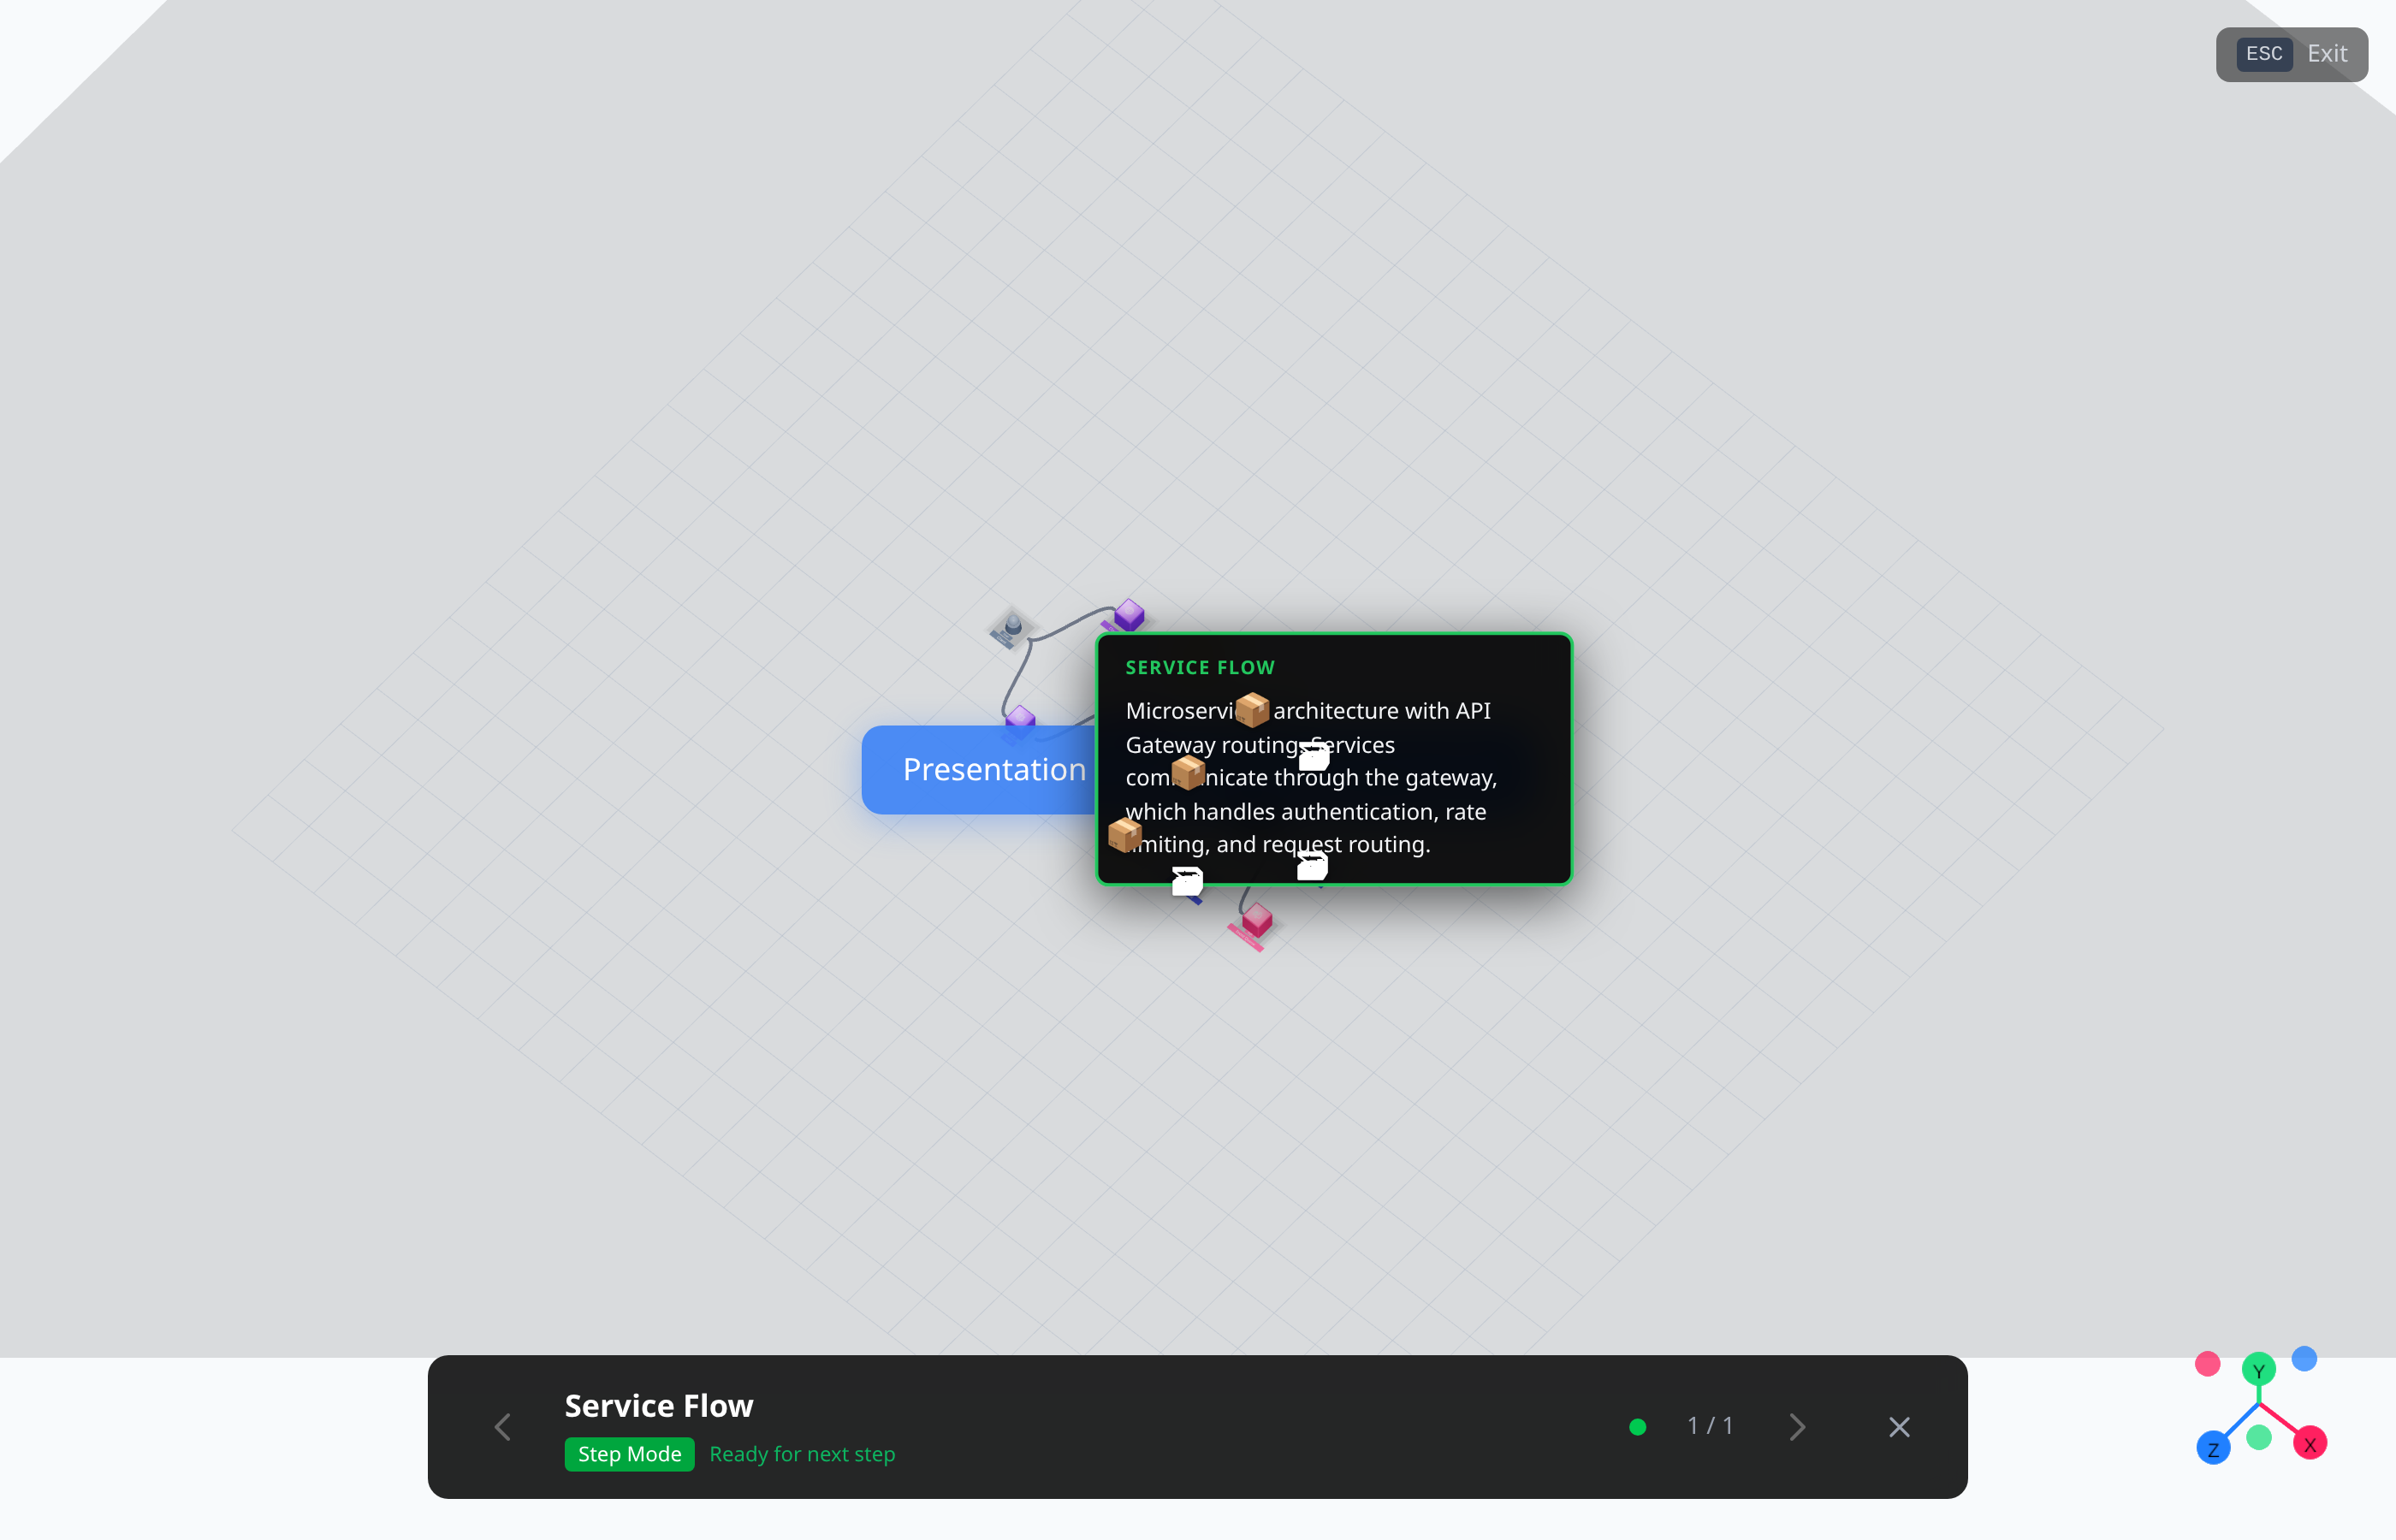
Presentations in 3D isometric view give a polished, professional look:
Saga Pattern - 3D Presentation:
CI/CD Pipeline - 3D Presentation:
Microservices - 3D Presentation:
Setting Up Pages
Before presenting, configure pages in the sidebar:
Starting a Presentation
F5)Navigation
| Control | Action |
|---|---|
| Space / Enter / Click | Advance to next step |
| Left Arrow | Go to previous page |
| Right Arrow | Go to next page |
| M | Toggle step/continuous mode |
| ESC | Exit presentation |
Play Modes
- Step Mode (default): Pauses at each page boundary, waits for you to click/press Space
- Continuous Mode: Plays through all pages automatically without stopping
Presentation Overlay
The bottom bar shows:
- Current page name
- Play mode indicator (Step Mode / Continuous)
- Status message ("Ready for next step" / "Playing...")
- Page counter (e.g., "3 / 7")
- Navigation arrows
- Close button
Import & Export
Exporting a Project
Importing a Project
File Format
Projects are saved as JSON with this structure:
nodes- All diagram nodes with positions, labels, and stylesedges- Connections between nodestracks- Animation tracks with keyframespages- Presentation pages with time ranges and descriptionssettings- View mode, grid, and other preferences
Keyboard Shortcuts
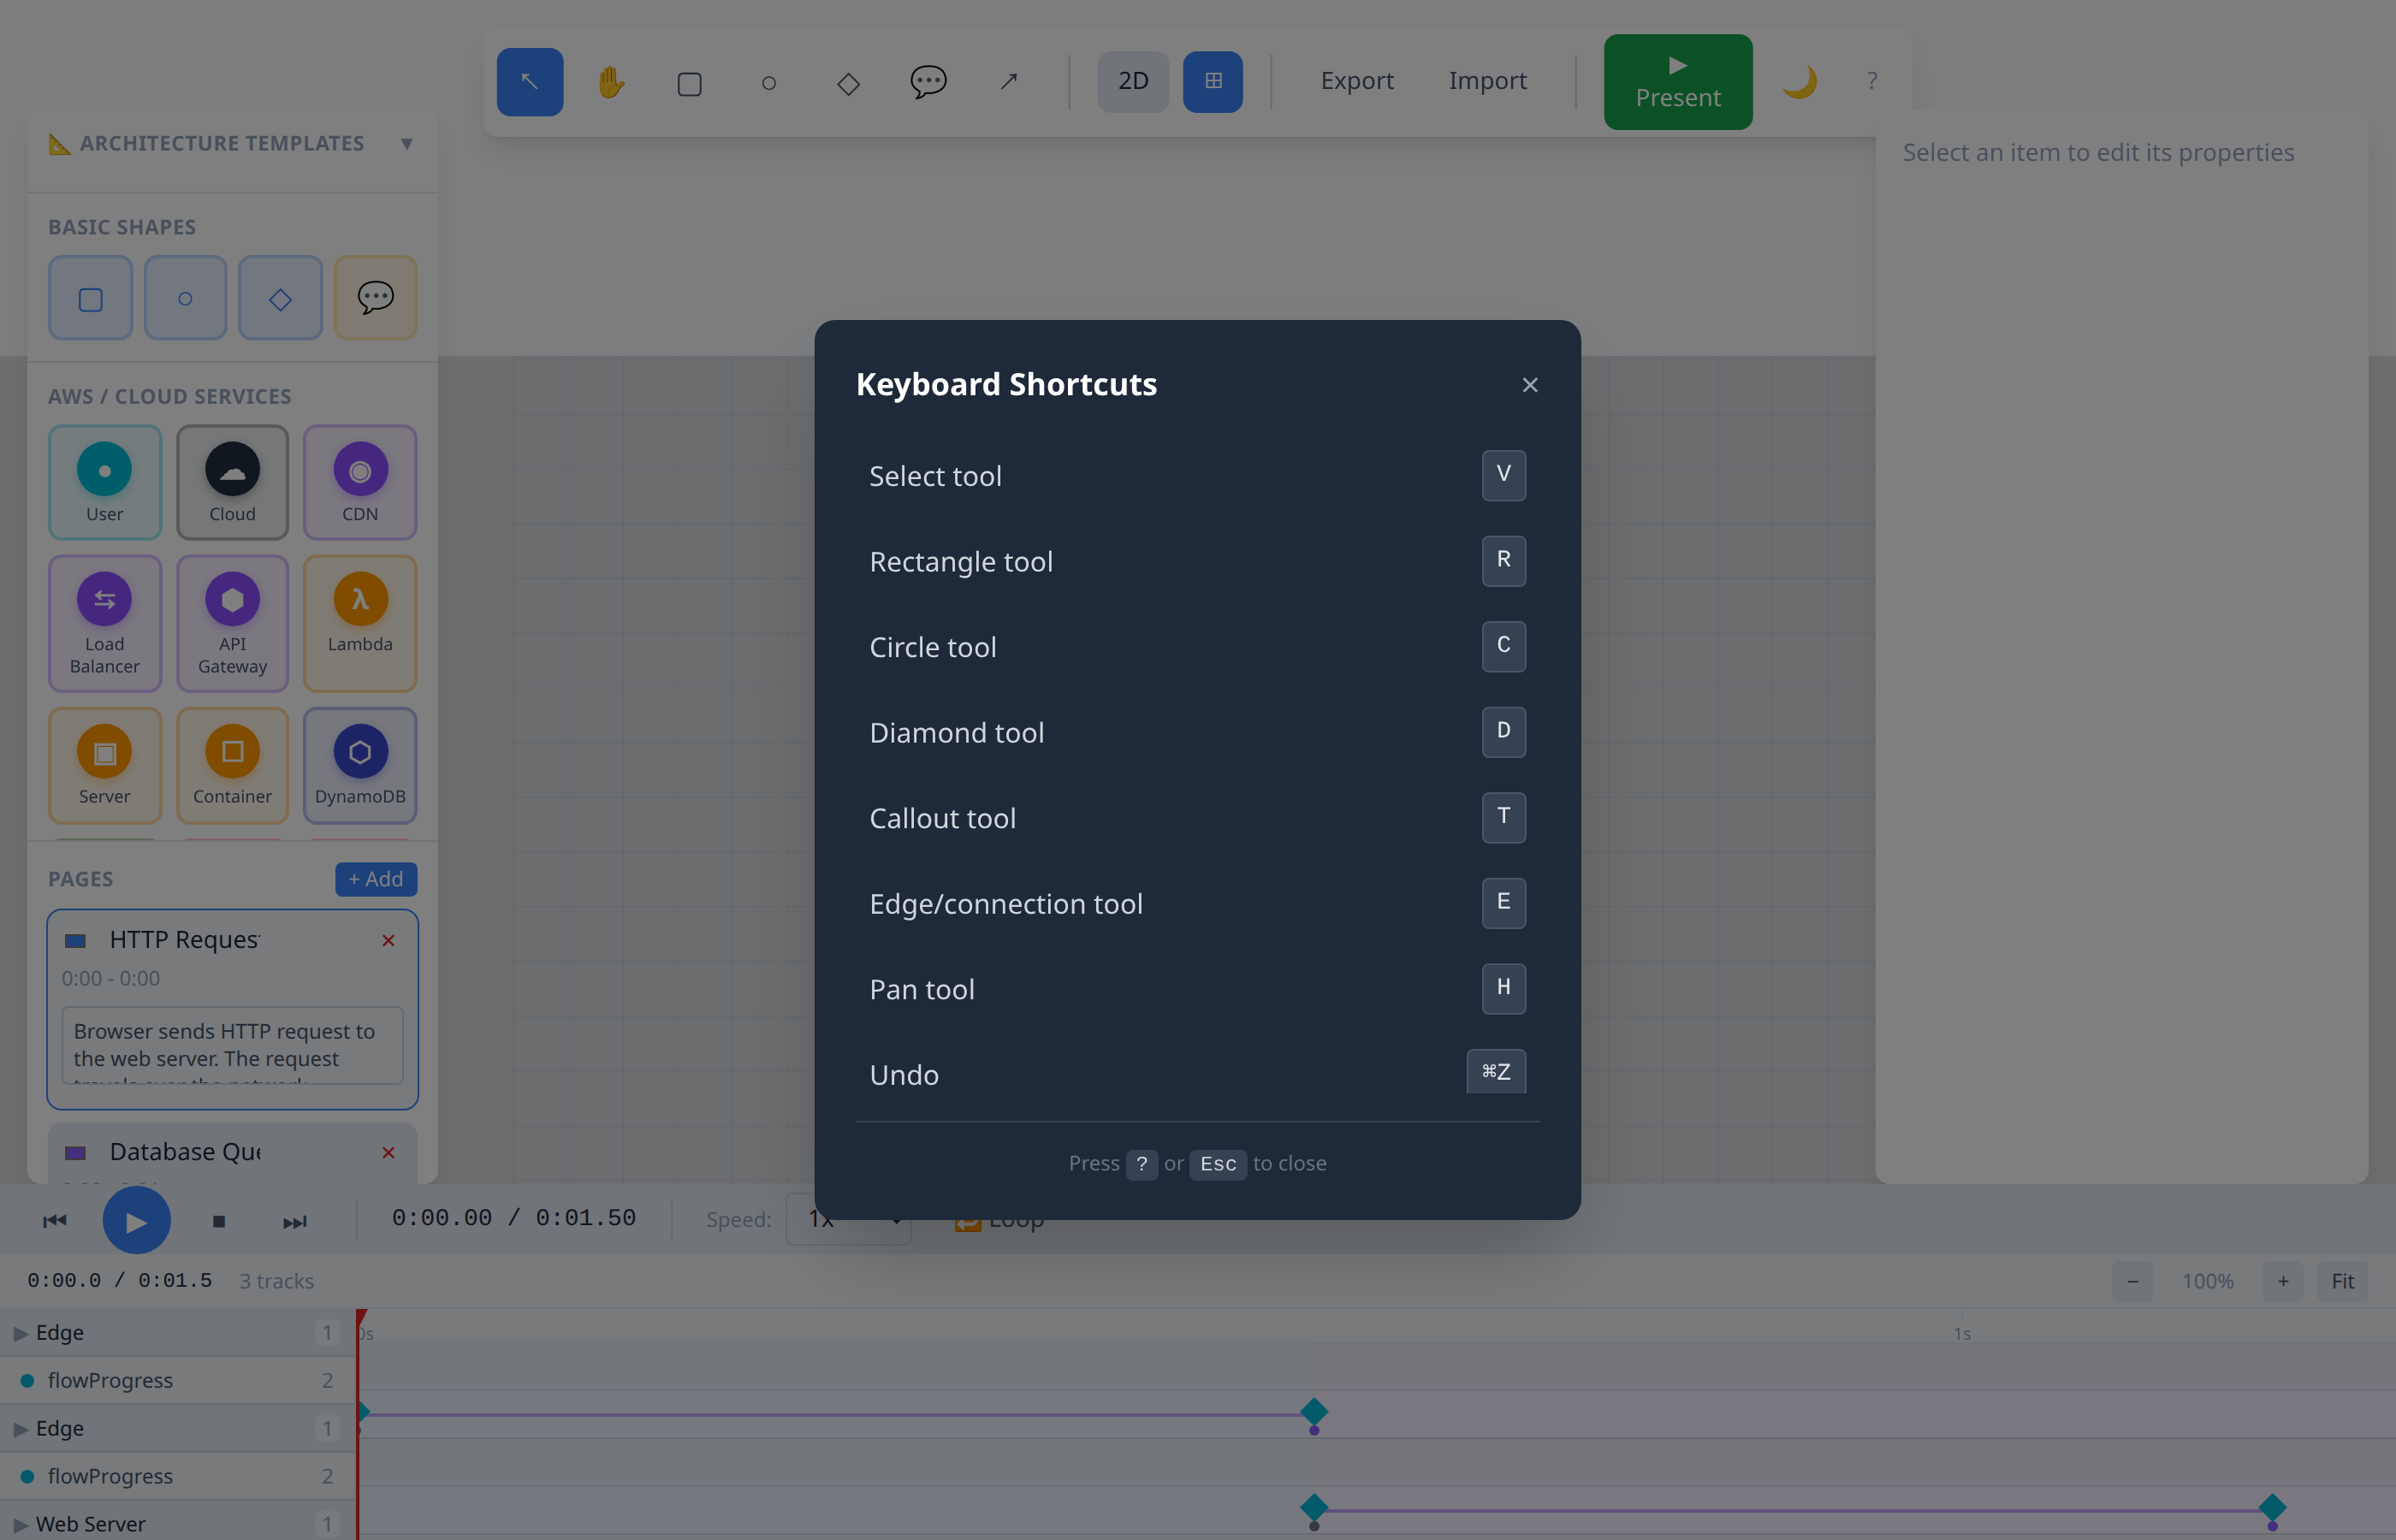
Tools
| Key | Action |
|---|---|
V | Select tool |
R | Rectangle tool |
C | Circle tool |
D | Diamond tool |
T | Callout tool |
E | Edge/connection tool |
H | Pan tool |
View
| Key | Action |
|---|---|
2 | Switch to 2D view |
3 | Switch to 3D isometric view |
G | Toggle grid |
T | Toggle theme (dark/light) |
Playback
| Key | Action |
|---|---|
Space | Play/Pause animation |
Home | Go to start |
End | Go to end |
Left Arrow | Step backward |
Right Arrow | Step forward |
Editing
| Key | Action |
|---|---|
Delete/Backspace | Delete selected |
Ctrl+Z | Undo |
Ctrl+Shift+Z | Redo |
Ctrl+C | Copy |
Ctrl+V | Paste |
Modals
| Key | Action |
|---|---|
? | Show keyboard shortcuts |
Ctrl+K | Open command palette |
Ctrl+Shift+A | Open animation templates |
Presentation
| Key | Action |
|---|---|
F5 | Enter presentation mode |
Space/Enter | Advance to next step |
Left Arrow | Previous page |
M | Toggle step/continuous mode |
ESC | Exit presentation |
3D Isometric View
Toggle between 2D and 3D views using the toolbar button or pressing Tab.
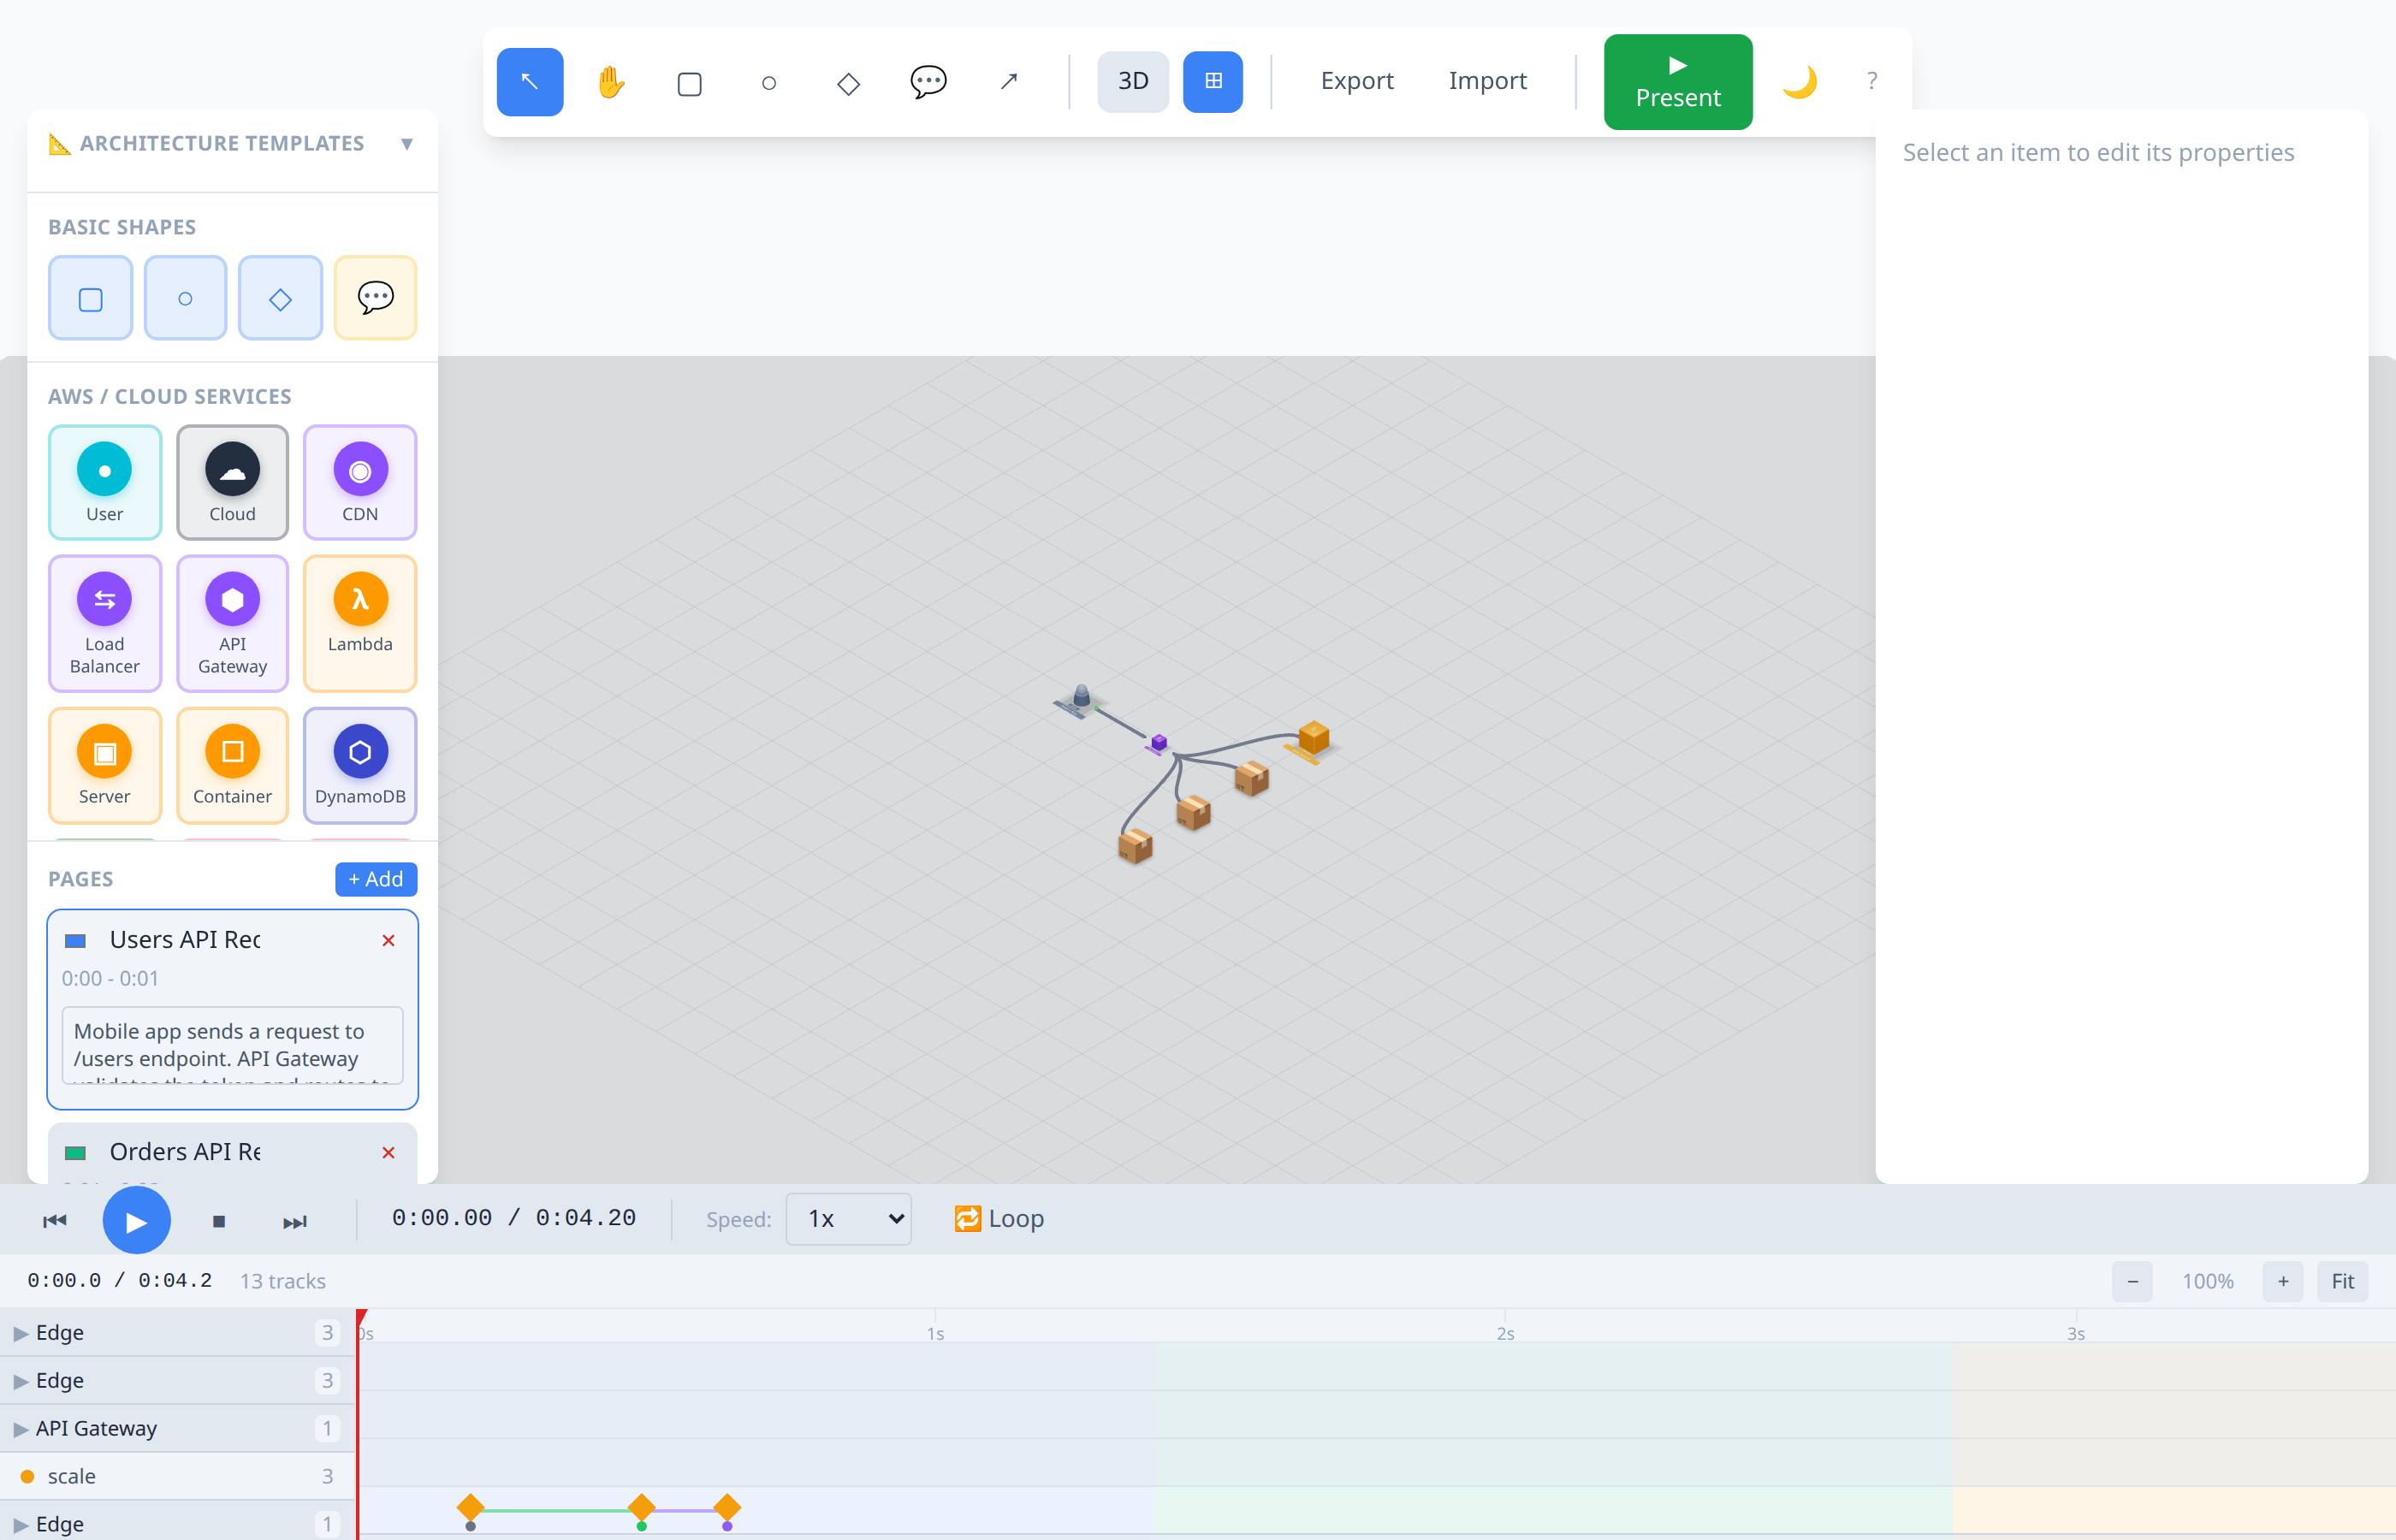
- 2D View: Top-down flat view, ideal for editing and precise positioning
- 3D View: Cloudcraft-inspired isometric view, great for presentations and visual appeal
- Nodes render as isometric boxes with depth
- Camera uses orthographic projection for clean isometric look
- All editing tools work the same in both views
- Labels scale correctly in both views
Command Palette
Press Ctrl+K to open the command palette for quick access to any action.
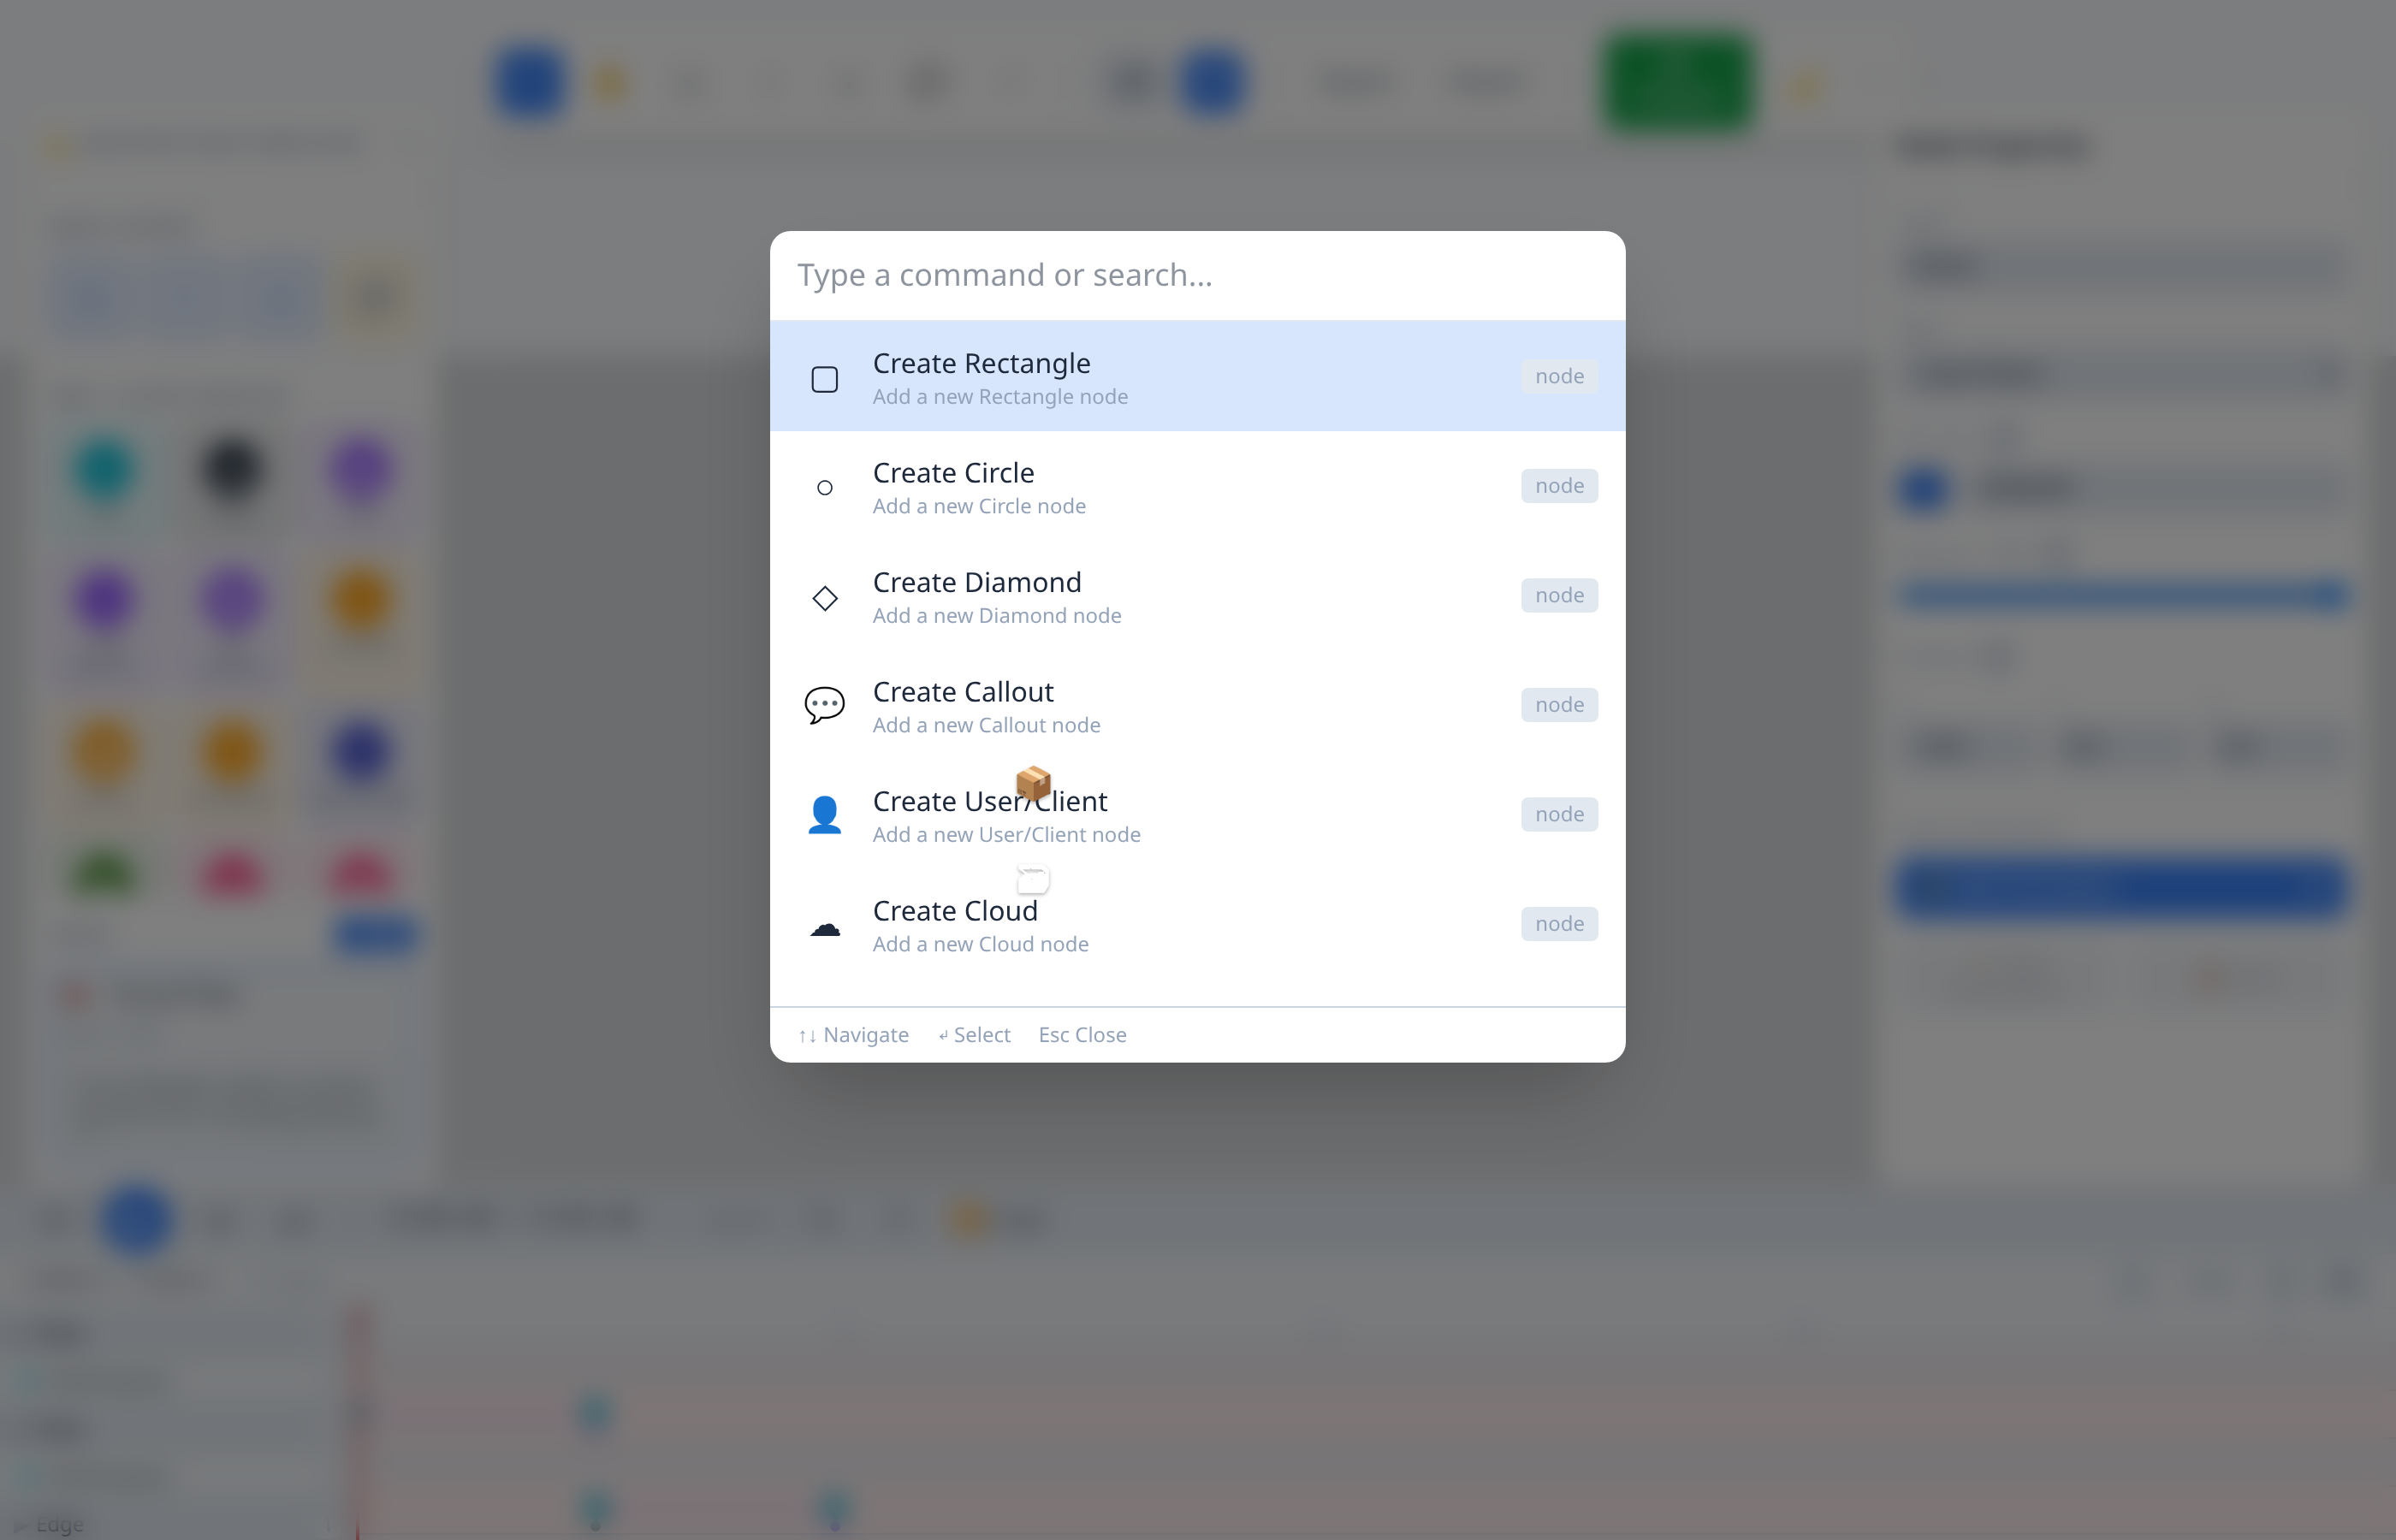
The palette provides searchable access to all editor commands and actions.