README
Meridian CRM
A Grafana observability reference implementation. A small CRM application built across seven Go microservices, designed to teach structured logging, distributed tracing, and metrics using the full Grafana stack.
https://github.com/jonathanleahy/meridian-crm
What This Is
Meridian CRM is a fictitious business CRM used internally by a small company. It manages clients, invoices, and products. It is not designed to be a great CRM. It is designed to show you how to find problems in a running distributed system using Prometheus, Loki, Tempo, and Grafana.
The system has eight deliberate faults — artificial delays, intermittent failures, fire-and-forget patterns, and an N+1 query problem. Everything is documented. Finding them is the exercise.
The Stack
| Layer | Technology |
|---|---|
| BFF | Go 1.23, gqlgen (GraphQL) |
| Services | Go 1.23, chi router, SQLite |
| Logging | Zap (structured JSON) |
| Metrics | Prometheus |
| Traces | OpenTelemetry → Grafana Tempo |
| Log aggregation | Grafana Loki |
| Telemetry agent | Grafana Alloy |
| Container metrics | cAdvisor |
| Dashboards | Grafana 10.4 |
| Alerting | Grafana Alerting (6 rules) |
| Frontend | Vanilla HTML + Tailwind CSS |
| Docs portal | React 18, Vite, Tailwind CSS |
| Simulation | Go simulator with 4 personas |
| Orchestration | Docker Compose |
Quick Start
Prerequisites
- Docker Desktop (or Docker Engine + Docker Compose on Linux)
- Git
Clone and Run
git clone https://github.com/jonathanleahy/meridian-crm.git
cd meridian-crm
docker compose up --build
The first run pulls images and builds the Go binaries. Allow 5–10 minutes. On subsequent runs it is much faster.
What Opens Where
| Service | URL |
|---|---|
| CRM frontend | http://localhost |
| Docs portal | http://localhost:4000 |
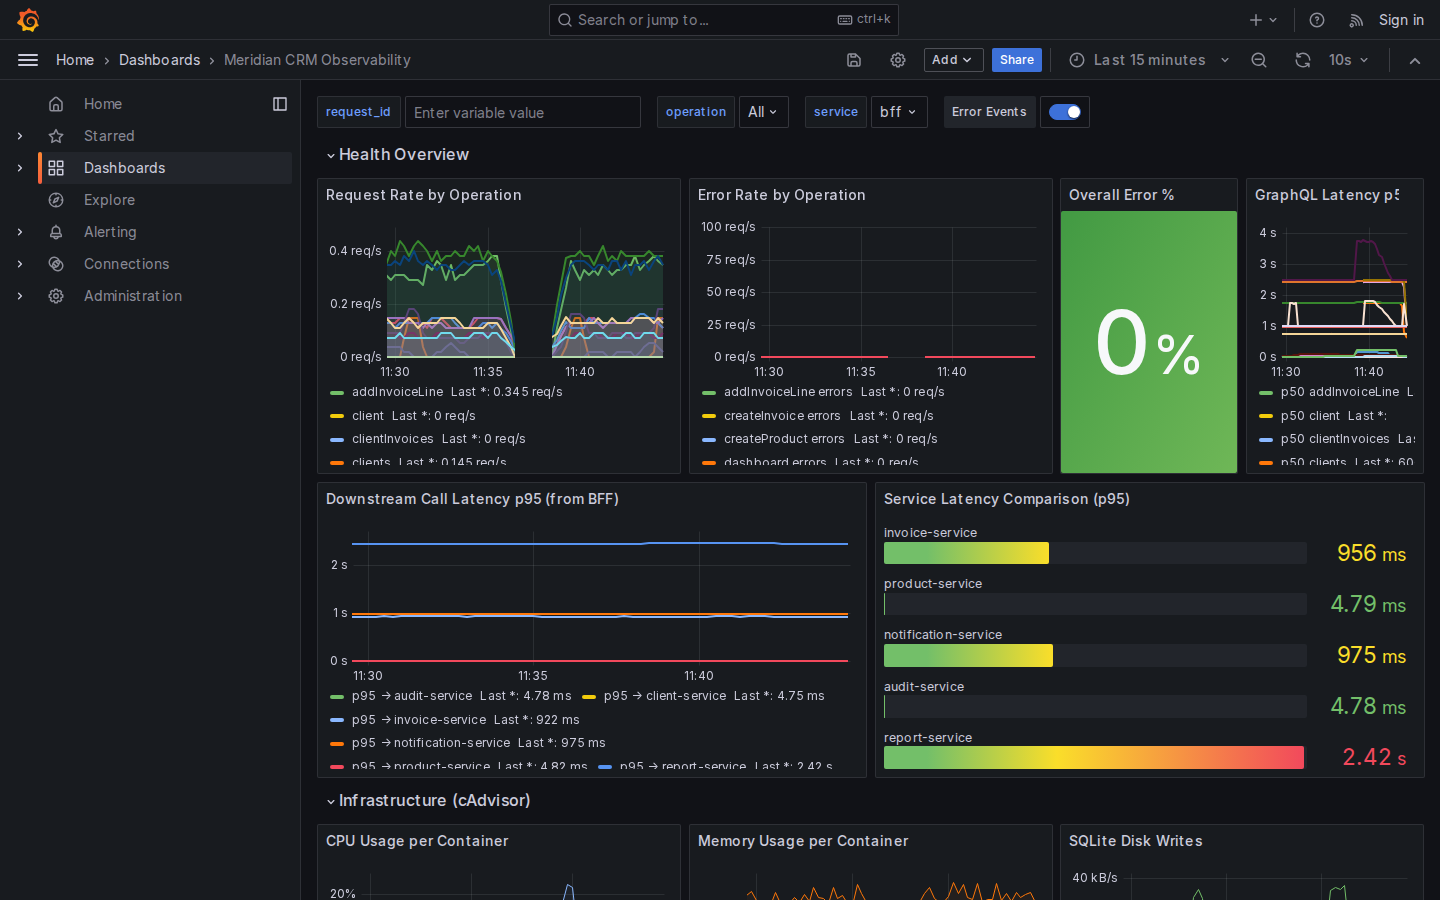
| Grafana | http://localhost:3000 |
| GraphQL API | http://localhost:8080/graphql |
| Prometheus | http://localhost:9091 |
admin / admin.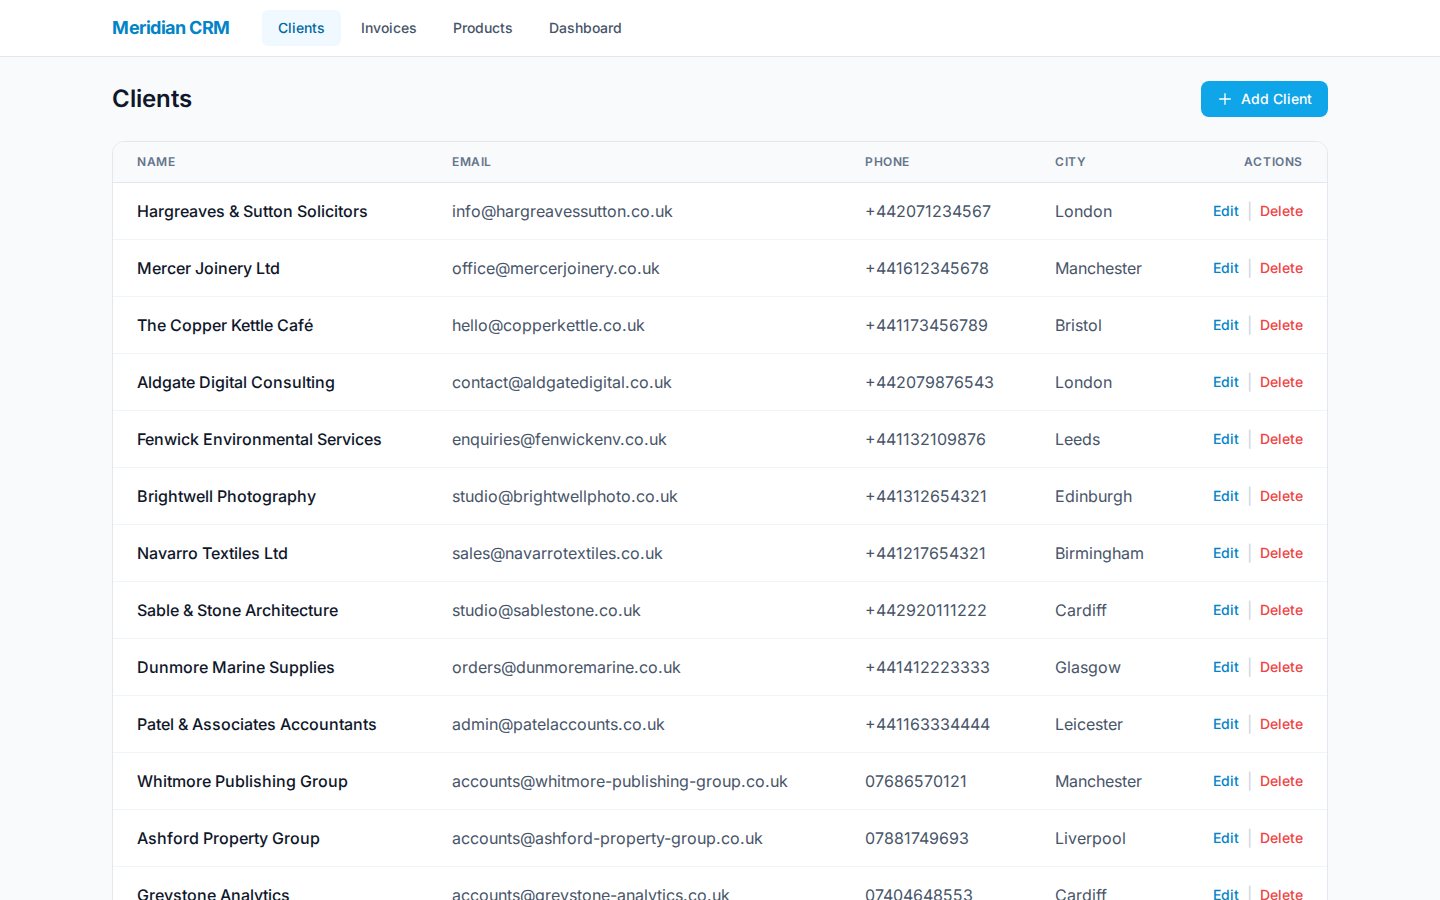
With the Simulator
docker compose --profile simulation up --buildThis starts four concurrent user personas — Alice, Ben, Carol, and Dave — generating realistic CRM traffic. Within a few minutes the Grafana dashboard shows latency spikes, error rates, and notification failures.
All at Once (Makefile)
make dev-all    # Starts everything including the simulator
make dev        # Starts everything without the simulator
make down       # Stops and removes containers
make reset      # Stops, removes containers and volumes (wipes all data)
Repository Layout
meridian-crm/
├── bff/                    GraphQL BFF (the only service the browser calls)
├── client-service/         REST service — clients and addresses
├── invoice-service/        REST service — invoices and line items
├── product-service/        REST service — product catalogue
├── notification-service/   REST service — notification events (600ms delay)
├── audit-service/          REST service — audit log (fire-and-forget)
├── report-service/         REST service — dashboard aggregates (1200ms delay)
├── simulator/              Go binary simulating 4 user personas
├── frontend/               Single-file HTML CRM UI
├── docs-portal/            React documentation portal
├── docs/                   All project documentation (markdown)
├── config/                 Prometheus, Loki, Tempo, Alloy, Grafana configs
├── scripts/                setup.sh — downloads Go modules and npm packages
├── docker-compose.yml
├── go.work                 Go workspace (all services share one workspace)
└── Makefile
Service Architecture
Browser
  │
  │  GraphQL (port 8080)
  ▼
 BFF ──────────────────────────────────────────────────────┐
  │                                                         │
  │  HTTP                                                   │
  ├── client-service   :8081   (300ms on GET /clients)     │
  ├── invoice-service  :8082   (800ms on list + lines)     │ audit-service :8085
  │     └──► product-service   (product validation on AddLine)  (fire-and-forget,
  ├── product-service  :8083   (no delays — control case)  │  configurable fail)
  ├── notification-svc :8084   (600ms, configurable fail)  │
  └── report-service   :8086   (1200ms — slowest service)  │
                                                           ─┘
Each service:
  - SQLite database (separate, never shared)
  - Zap JSON logs → Alloy → Loki
  - Prometheus metrics on :91xx
  - OpenTelemetry traces → Alloy → Tempo
  - Hexagonal architecture (domain / port / adapter)
  - OpenAPI 3.1 spec
Development
Running Go Services Locally
After cloning, run the setup script once to download all Go modules and npm packages:
./scripts/setup.shThen you can run individual services outside Docker:
cd client-service && go run ./cmd/seed && go run .
Running Tests
make test           # Unit and integration tests for all Go services
make test-all       # Includes E2E tests
Individual service:
cd client-service && go test ./...
Go Workspace
The repository uses a Go workspace (go.work). You can build any service from the root:
go build ./client-service/...
go test ./client-service/...
The Eight Faults
| # | Service | Fault | How to Find |
|---|---|---|---|
| 1 | invoice-service | 800ms delay on GET /invoices | Loki: {service="invoice-service"} \| slow_request=true |
| 2 | invoice-service | 800ms delay on GET /invoices/:id/lines | Same as above |
| 3 | client-service | 300ms delay on GET /clients | Loki: {service="client-service"} \| slow_request=true |
| 4 | notification-service | 600ms delay on POST /notifications | P95 latency panel in Grafana |
| 5 | notification-service | Intermittent failures (NOTIFICATION_FAILURE_RATE) | Error rate panel + Loki error logs |
| 6 | audit-service | Silent failures (AUDIT_FAILURE_RATE, fire-and-forget) | Audit failures panel |
| 7 | report-service | 1200ms delay on GET /report/dashboard | Dashboard latency panel |
| 8 | BFF | N+1 product fetches per invoice line | Trace waterfall in Tempo |
Documentation
All documentation lives in docs/ and is served via the docs portal at http://localhost:4000.
| Document | What It Covers |
|---|---|
docs/spec.md | Full technical specification |
docs/requirements.md | Why the system is designed this way |
docs/services.md | All seven services in detail |
docs/observability.md | Metrics, logs, traces, and alerting |
docs/testing.md | TDD policy and test architecture |
docs/known-issues.md | The eight faults with investigation steps |
docs/simulation.md | The simulator and four exercises |
docs/user-guide.md | Getting started guide |
docs/personas.md | The team and simulated users |
docs/seed-data.md | UK business seed data |
The Team
- Jan — Senior Software Engineer. Hexagonal architecture, TDD, store interfaces.
- Lyn — Site Reliability Engineer. Observability stack, fault design, alert rules.
- Sam — Technical Writer. All documentation prose.
- Frank — Test Engineer. Simulator, user journeys, four exercises.
- Priya — Frontend Developer. HTML frontend, request_id logging.
- Maya — Documentation Engineer. Docs portal, OpenAPI spec review.
Licence
MIT. Use this however you like.