README
Fluid Intake Tracker
A computer vision system that watches a patient's cup through a webcam and automatically tracks how much they drink throughout the day. Point a camera at a glass, and the system uses YOLO object detection to find it, analyses the liquid level inside, and records every sip. It was built to help caregivers monitor hydration for people who can't easily self-report their intake.
How it works
The system runs a continuous loop: the webcam feeds frames into a YOLO neural network (GPU-accelerated when available, CPU as fallback) that identifies cups, glasses, wine glasses, and bottles in the scene. Once a drinking vessel is found, the region inside the bounding box is cropped out and passed to a liquid level detector. That detector uses a combination of colour saturation analysis (for coloured drinks like tea or juice) and brightness gradient detection (for clear water) to estimate where the surface of the liquid sits within the glass.
The clever part is the consumption tracking. The system doesn't try to measure absolute volume in real-time — that would be too noisy. Instead, it remembers the liquid level when the cup disappears from frame (someone picked it up), and compares it to the level when the cup comes back. If the level dropped, that's a drink. If it rose, that's a refill. Small changes under 20% are ignored as noise, and the system waits a few seconds after the cup returns before taking a reading, giving the liquid time to settle.
Readings are stabilised using mode-based smoothing — the most frequently seen value over a rolling 30-second window becomes the "current level." This means even if individual frames are a bit off, the reported level stays consistent. Outlier rejection catches single-frame spikes that would otherwise corrupt the data.
Everything is logged to timestamped CSV files, and a web dashboard (served via Flask) gives a live view of the current level, total consumption, and an event history with a Chart.js graph showing level changes over time.
Screenshots
Press c during monitoring to capture screenshots. They are saved to the screenshots/ directory.
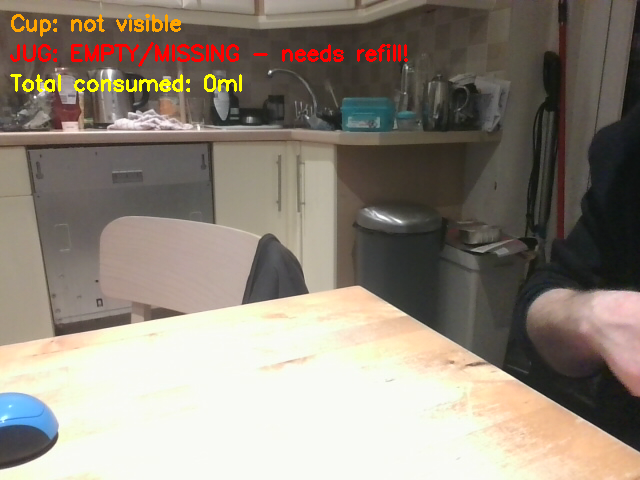
No cup detected — the system shows "Cup: not visible" and waits for a drinking vessel to appear in frame.
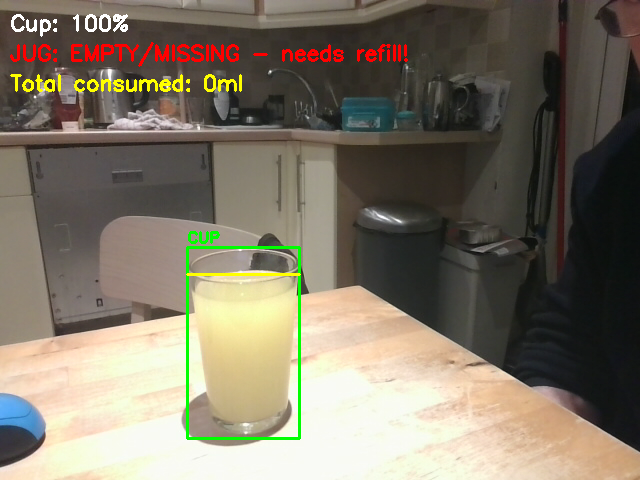
Cup detected at 100% — YOLO has found the glass (green bounding box) and the level detector estimates it as full. The yellow line marks the detected liquid surface.
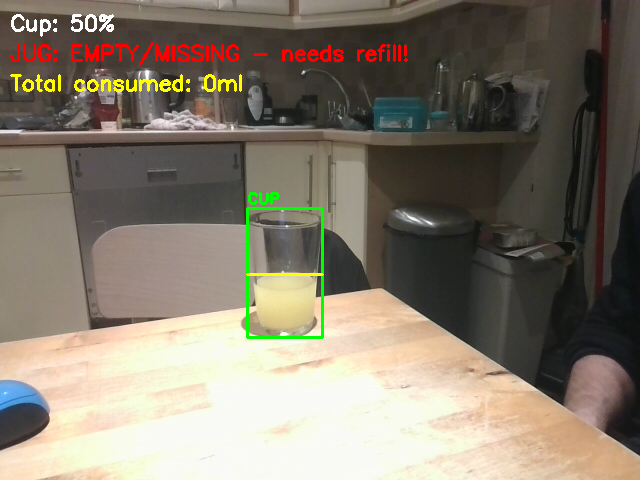
After drinking — 50% — the glass was picked up, some juice was consumed, and the glass was returned. The system detected the level drop and updated the reading.
Getting started
You will need Python 3.10 or later, a webcam, and ideally an NVIDIA GPU (though CPU works fine, just slower). The system has been tested on Ubuntu with both Wayland and X11.
cd fluid

# Create a virtual environment and install dependencies
python3 -m venv venv
source venv/bin/activate
pip install -r requirements.txt
The first run will download the YOLO model (~6MB) automatically.
Running the tracker
source venv/bin/activate
python -m src
The system opens a camera window showing the live feed with detection overlays. A green rectangle appears around detected cups, and a yellow line marks the estimated liquid level. The web dashboard launches automatically at http://localhost:5000 (or the next available port).
Keyboard controls
- q — Quit the application
- r — Reset the consumption total back to zero
- c — Capture a screenshot (saved to
screenshots/)
The web dashboard
Open the URL printed at startup in any browser. The dashboard shows five cards across the top: current fill level as a percentage, current volume in millilitres, total consumed, cup status (present or away), and jug status. Below that, a real-time chart plots the fill level over time, and an event log lists each drink and refill with timestamps and volumes.
The dashboard connects via Server-Sent Events, so it updates in real-time without polling. If the connection drops (say you restart the tracker), it automatically reconnects after three seconds.
Tips for best results
The biggest challenge is clear water in a clear glass — this is genuinely hard for any computer vision system. The detector works much better with coloured drinks like tea, coffee, juice, or cordial, where there's an obvious colour boundary between air and liquid.
If you need to track clear water, try positioning a dark background behind the glass, using side lighting to create visible refraction patterns, or angling the camera to catch light reflections on the water surface. Even a piece of dark card behind the glass makes a noticeable difference.
Consistent lighting matters more than perfect lighting. The system compares before-and-after levels, so even if the absolute reading is off by 10-15%, it still correctly measures how much was consumed. A steady desk lamp works better than variable overhead lighting.
The cup capacity defaults to 500ml. If your glass is a different size, change it in src/main.py where SimpleCalibrator(full_ml=500) is initialised. The minimum change threshold (20%) and settle time (3 seconds) can be adjusted in src/tracker.py.
What gets logged
Each session creates a CSV file in the data/ directory named with the session timestamp. The file records every frame's reading: timestamp, fill percentage, estimated volume in ml, any events (drink/refill), event volume, and cumulative consumption. Console output is kept minimal — only drink and refill events are printed.
Project structure
fluid/
├── src/
│   ├── main.py           Entry point and main loop
│   ├── capture.py         Threaded webcam capture
│   ├── detector.py        Liquid level analysis (saturation + gradient)
│   ├── tracker.py         State machine for consumption tracking
│   ├── autodetect.py      YOLO object detection wrapper
│   ├── calibration.py     Interactive ROI calibration UI
│   └── logger.py          CSV session logging
├── web/
│   ├── templates/
│   │   └── index.html     Dashboard page
│   └── static/
│       ├── app.js         SSE client, Chart.js visualisation
│       └── style.css      Dark theme dashboard styling
├── data/                  Session CSV logs (gitignored)
├── screenshots/           Captured screenshots (gitignored)
├── requirements.txt
└── README.md
Limitations
Level detection is approximate, typically within 10-15% of the true value. This system is designed for tracking trends and total intake over a session rather than precise millilitre measurements. It works best as a "did they drink enough today?" tool rather than a laboratory instrument. The focus on before/after comparison when the cup is picked up and returned means that even consistently inaccurate readings still produce useful consumption data.